

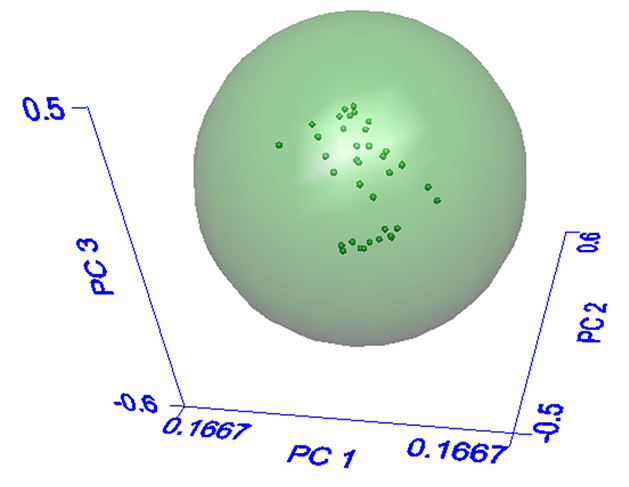
An algorithm known as soft independent modeling of class analogy, or SIMCA is often applied for identification of ingredients where modest-to-high natural variation is expected.3 A “training set” of known good materials is assembled and covers a wide range of the ingredient’s expected variability. The algorithm utilizes the spectral data in the “training set” like the way the human mind interprets photographs. When looking at a photograph, an observer’s eyes “clue in” on objects of interest, also using the quantity of these objects to understand the context of the photo. For example, a photo with many buildings, cars and people would be judged as an urban setting, whereas a photo devoid of all three would be classified as a rural setting. Likewise, the SIMCA algorithm breaks down the spectral data in the training set into types of spectral changes, referred to as “principal components” or “factors”, and relative magnitude of spectral changes, referred to as “scores”. Boundaries are established based on the range of scores in the training set, as shown graphically in Figure 4. The green sphere in Figure 4 represents the acceptable range of sample variation, and each dark green dot is one known-good sample spectrum. Each of the three axes represents a principal component, or type of spectral change, and the distance along each axis represents the corresponding score, or relative magnitude of the principal component. The number of principal components required for a robust method will depend on the degree of variation in the ingredient, with more highly variable ingredients requiring more principal components to describe the types of chemical changes occurring in the material.
The SIMCA algorithm provides added benefits when applied in this setting. Well-developed multivariate methods utilize genuine spectral signatures in discrimination of ingredients, with less sensitivity to random measurement noise. Additionally, two diagnostic values can be calculated from this algorithm, which can indicate the cause for an ingredient failing the test: Model distance and residual distance. A high model distance value tells the analyst that the tested ingredient has spectral features (and therefore chemical composition) like that of the samples in the training set but is simply “out-of-spec”. As an example, a milk powder sample might fail with high model distance if the ingredient had taken on excessive moisture during shipping or handling. A high residual distance indicates the presence of spectral features that are dissimilar to those in the training set, which might signal the appearance of foreign material, such as an adulterant.
Capabilities of the SIMCA algorithm can be further extended with an approach like that of the spectrum adulterant screen. This algorithm will calculate an expected spectrum for the ingredient based on the known-good sample spectra in the user’s SIMCA method and calculate the difference between the tested ingredient spectrum and the expected spectrum for that ingredient. Next, the expected spectrum is calculated with spectra of potential or likely adulterants added to the data, and the process is repeated iteratively for each adulterant spectrum. This process is illustrated in Figure 5.

When testing good, unadulterated material, the inclusion of the adulterant spectrum in the calculated spectrum will decrease the similarity between the material spectrum and calculated spectrum. This causes the residual to increase, which is an indicator that the adulterant is not present at significant levels in the material. The increased residual is an indicator that the adulterant is not present at significant levels in the material. However, if the residual decreases when the spectrum of an adulterant is added to the calculated spectrum, this may indicate the presence of the adulterant in the tested sample. Contribution of each principal component and the adulterant spectrum to the calculated spectrum is scaled via a least-squares fit, which also provides an approximate concentration of a detected adulterant.
Food fraud and adulteration detection is increasingly performed with FTIR instrumentation due to decreasing cost and footprint of the technology, as well as software and algorithmic advances, which provide robust means for discriminating materials, with ever-increasing user-friendliness. This technique, in combination with statistical models, provides rapid and non-destructive compositional screening with little to no sample preparation. Moreover, the technique offers non-targeted analysis, with the ability to detect many foreign or incorrect materials based on their spectral signature. As such, FTIR is a fantastic first line of defense when protecting your company’s brand reputation.
References
- Koeris, M. ( September 4, 2018). The True Costs You Endure During a Food Recall. Accessed November 4, 2019. Retrieved from https://foodsafetytech.com/column/the-true-costs-you-endure-during-a-food-recall/.
- Baer, C.D., and Brown, C.W. (1977). Identifying the source of weathered petroleum: matching infrared spectra with correlation coefficients. Applied Spectroscopy 31(6), 524-527.
- Wold, S., and Sjostrom, M., (1977). SIMCA: A method for analyzing chemical data in terms of similarity and analogy, in Kowalski, B.R., ed., Chemometrics Theory and Application, American Chemical Society Symposium Series 52, Wash., D.C., American Chemical Society, p. 243-282.
Related Articles
-


Get the latest on regulatory and GFSI requirements.
-

Criminal food adulteration is still an underestimated, yet growing issue in Europe.
-

The database helps companies make decisions about food fraud vulnerability and economically motivated adulteration.
-
The latest violations come from a ketchup factory in Pakistan.