
One of the key benefits of LC-IRMS is the ability to determine carbon isotope fingerprints for each individual sugar component, comparable to EA-IRMS, which provides a carbon isotope fingerprint for all sugars in the honey. In this way, a comparison of δ13C of fructose and glucose, as well as the detection of other unknown sugars and the honey’s sugar pattern, can be determined within a single sample analysis. A representative LC-IRMS chromatogram for honey is shown in Figure 2.
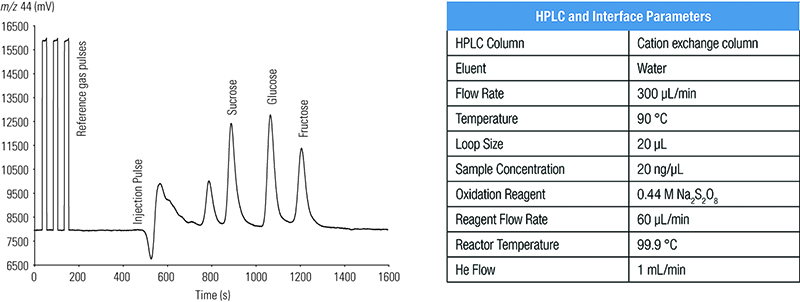
Table I reports data from eight honey samples analyzed using LC-IRMS and EA-IRMS to identify adulterated and unadulterated honey. A Thermo Scientific LC IsoLink IRMS System was used to analyze the honey samples in a comparative study with EA-IRMS.6 These data show that two cases of adulteration (Samples 1 and 5) were identified using EA-IRMS and four adulterated honeys (Samples 1, 2, 5, and 8) were detected using LC-IRMS.
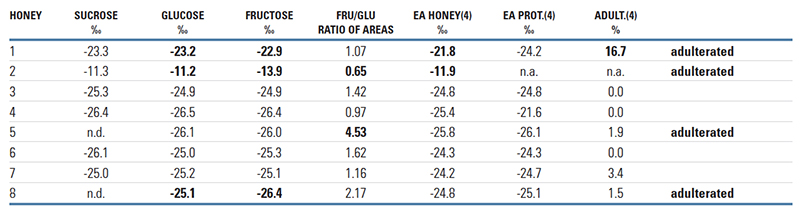
Despite exhibiting a normal fructose/glucose ratio of 1.07, honey sample 1 was suspected to be adulterated due to the less negative δ13C of the honey, relative to the protein. For honey sample 2, the significantly lower glucose content relative to fructose, and its resulting fructose/glucose ratio of 0.65 gives a clear indication of adulteration. Additionally, the 2.7‰ more negative δ13C value of fructose than glucose provides additional evidence to support this conclusion. Honey sample 5 is also adulterated, identified from the high fructose/glucose ratio of 4.53. Honey sample 8 was also identified as adulterated, from the difference of 1.3% in the δ13C values of glucose and fructose, as well as the high fructose/glucose ratio of 2.17. However, this conclusion could not be reached using the EA-IRMS data, as a δ13C difference of 0.3‰ (i.e., 1.5% adulteration with C4 derived sugar) is within the uncertainty of the method according to the AOAC method 998.12. However, the data clearly show that the combination of EA-IRMS and LC-IRMS can detect a wide range of honey adulteration, even at low levels, demonstrating the power of isotope fingerprints in detecting food adulteration.
Summary
EA-IRMS is a robust and proven technology for isotopic ratio measurement and can be used as a routine and reliable approach for the identification of honey adulteration, following the AOAC 988.12 official method. For low concentration adulteration, compound specific analyses using LC-IRMS benefits from enhanced analytical sensitivity and the ability to identify individual sugar isotope fingerprints. With adulteration a significant issue for honey manufacturers and suppliers, carbon isotope fingerprinting provides the industry with a powerful, robust and versatile solution to the challenge of safeguarding product integrity.
Continue to the sidebar on page 3 below: Follow the Honey: Safeguarding Food Integrity Using Integrated Informatics
Related Articles
-


Get the latest on regulatory and GFSI requirements.
-
The handheld system features a new software platform, enhanced optical technology and wireless connectivity.
-


Providing practical and simple solutions are important when promoting adherence.
-

Food fraud has significant economic and public health implications, and companies should be prepared to go beyond FSMA requirements to confront the threat.
Related Articles
-
Get the latest on regulatory and GFSI requirements.
-
The handheld system features a new software platform, enhanced optical technology and wireless connectivity.
-
Providing practical and simple solutions are important when promoting adherence.
-
Food fraud has significant economic and public health implications, and companies should be prepared to go beyond FSMA requirements to confront the threat.
which brands of honey or countries of origin of honey adulterate their product?