Beyond the Recall Count: A Leading-Indicator Framework for Measuring Food Safety System Health


The annual number of food recalls is a common way to judge the performance of the food safety system, but it is just as likely an increase is caused by improving data and communication capabilities as by worsening safety. This reflects the same trade of central bankers faced decades ago: No single, backward-looking stat tells a policy maker or an industry participant if a given system is healthy or in imminent failure today. The Fed doesn’t run the economy using solely the unemployment rate; instead, it monitors multiple leading and concurrent statistics so it can take pre-emptive action while a downturn can be “confirmed” in any single widely followed metric.
Here we propose just such a dual scoreboard, comprised of leading and lagging statistics taken from actual operations and the system’s output — as expressed through recall and outbreak incidents. The work is the first application of the concepts on top of a tier approach to supplier risk employed throughout a multi-supplier grocery distribution system and presented as a launch pad for further industry and regulatory comment.
1.The Problem with a Single Headline Number
When recall numbers get high there are two possible stories. One is that contamination, the nature of them is getting worse, there are more of them, they are being handled less responsibly. The second story is that your processes are working. It should be this, testing, verification of your supplier, tracking and a really rigorous verification program that catches a contamination at the receiving warehouse instead of at a retailer or finally when consumers get it home and this fact (which you are providing with a verifiable test that caught it before the goods got into the warehouse), it really should be incentivized.
However, if this contamination that you detected before the product gets into the warehouse causes an increase to a recall numbers that the consumer is seeing as failure, then you have incentivized that program to not detect the contamination, not perform the tests and so it has made your score look good on a single index scorecard, but you are actually not safe.
This isn’t just an imagined worry. If across the 1,000+ supplier network, one thing is universally reported in operations it is this: if the number of nonconformances increases, the most frequent response is that enforcement and inspections are improving rather than that the food supply is becoming riskier. Using the recall count on its own to indicate the health of a system undermines the visibility we are trying to engineer with preventative programs.
2. A Monetary Policy Analogy
Central bankers hit a variant of this a while back. Because inflation and unemployment are outcome measures-confirmable only after the fact and capable of revision-a policy regime anchored solely by them would be a policy regime always reacting to yesterday’s economy. For this reason, the Federal Reserve maintains what is now quite a long basket of measures, including leading indicators such as new orders, credit spreads and labor market churn, alongside the lagged outcome measures, so that policy can act on expected instead of confirmed economic conditions. No single number is being asked to bear this crucial burden alone.
Neither regulatory food safety governance nor in-company governance has always been as reliant on this discipline as it should be. Recall numbers and outbreak case counts are lagged outcome indicators, like an unemployment rate: they point out that a problem was experienced long after the operational decisions creating it were made. No system governed solely by examining these metrics will do anything but run the equivalent of an emergency room from 2007 to 2015.
3. A Paired Scorecard: Leading and Lagging Indicators
Here, we present a framework which links operational leading indicators, describing the day-to-day functioning of a prevention and verification system with lagging outcome indicators, describing what did or did not actually reach the consumer Table 1 shows an initial set of indicators derived from our experience in managing supplier compliance at scale.
Table 1.
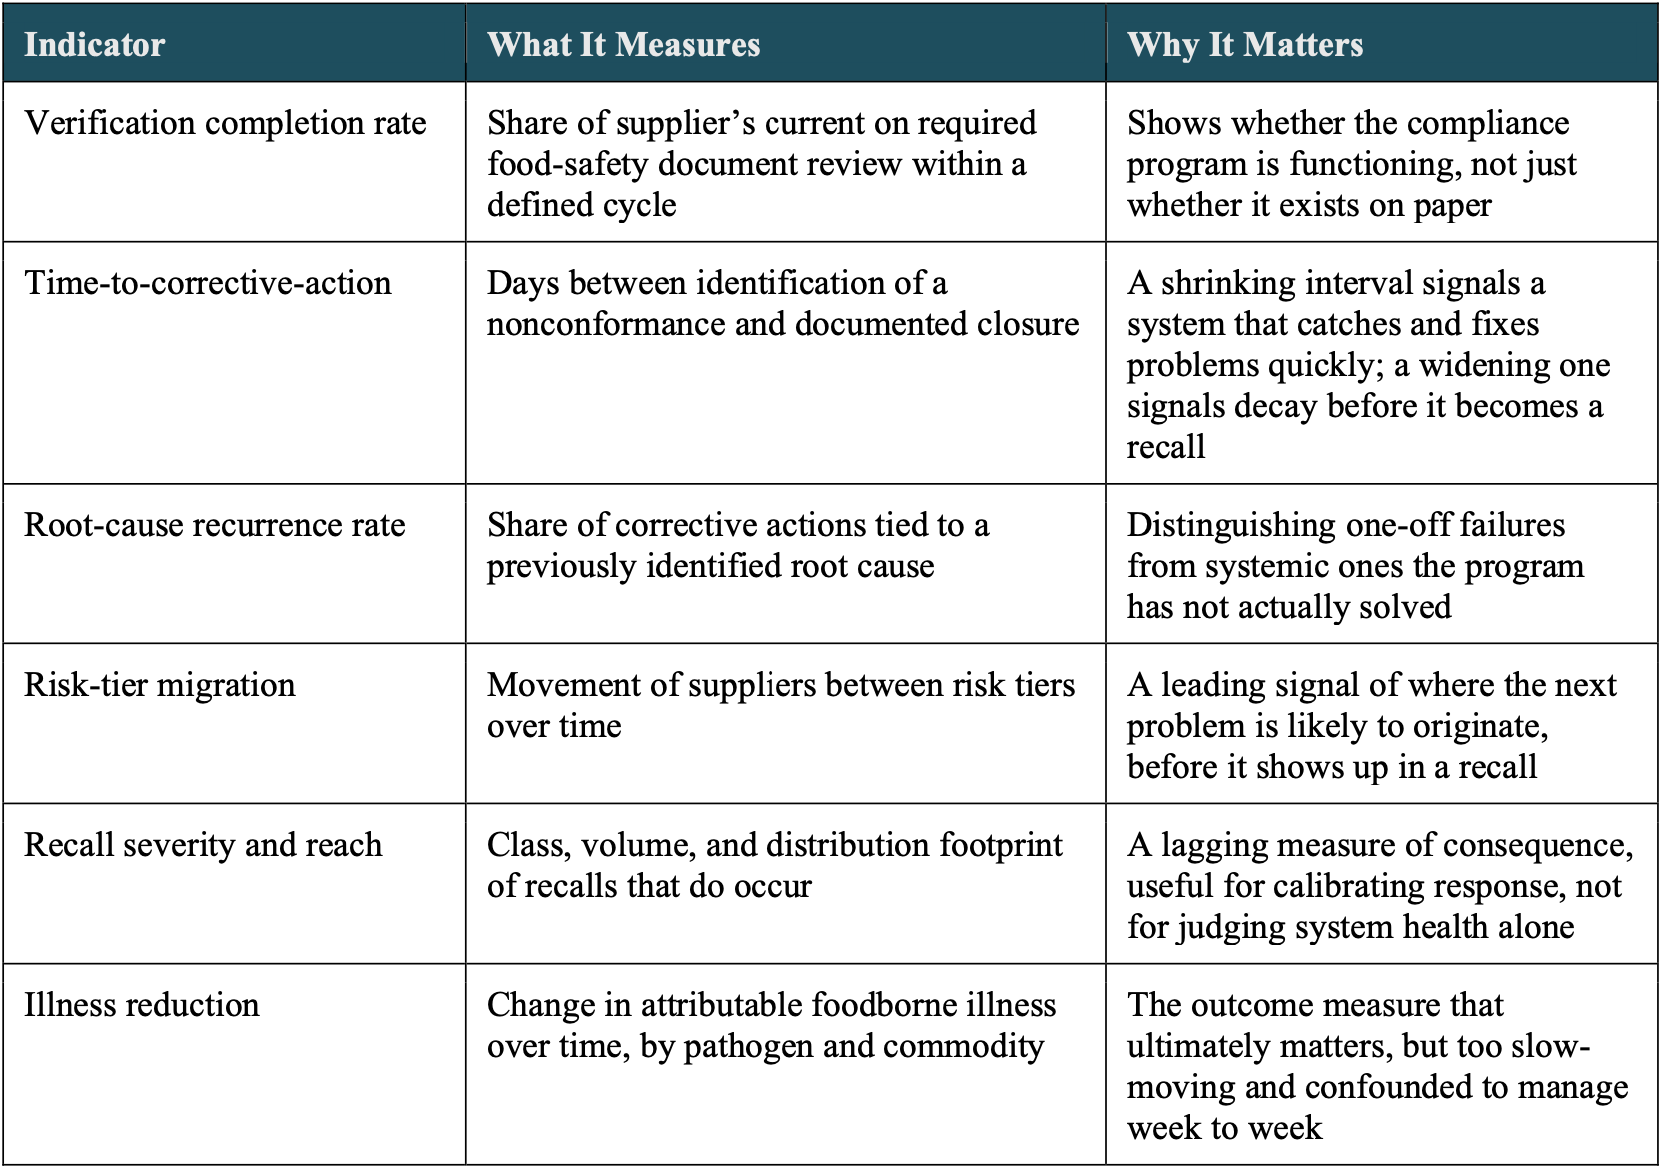

No single row in Table 1 is sufficient on its own. A high verification completion rate plus an increasing root-cause recurrence rate would signal a program that is great at paperwork but poor at fixing the issues it is discovering. A decreasing time-to-corrective-action plus a flat risk-tier migration rate would signal a system that is neither catching problems nor making sure that those problems are mitigated. The power of framework is in reading those metrics as a body just as the federal reserve may look at prices, employment and credit data together instead of separately
4. Grounding the Framework in a Tiered Risk Model
The approach is not entirely theoretical. It builds on a risk-based tiered supplier compliance model designed to oversee compliance for a vast and diverse supplier population for food safety assurance, because one cannot scale manually or with a one size-fits-all verification process on one size of suppliers. The supplier. tiering is based on categories of products provided, previous compliance record and specific product hazards – and varies the frequency and rigor of documentation review accordingly. Deployment of that system realized significant operational improvements to include drastic reductions in manual follow-up, greatly reduced supplier onboarding times, and 100 percent compliance with required food-safety documentation.
Those tiering mechanisms also produce much of the raw data required for a leading-indicator scorecard: total tier verification completion, total time-to-corrective-action by tier and change in tier over time for suppliers. A national or sector-level scorecard would require less new data capture than that already produced by good supplier verification programs – including those that will exist under the FSMA Food Traceability Rule and those required under GFSI benchmarks.
5. Toward Implementation
A move from concept to action will require consensus on a handful of open questions, presented here as a point for discussion rather than a closed case. Definitions and denominators – how to come to consensus on what constitutes a ‘supplier,’ a ‘verification,’ and a closed ‘corrective action’ so that indicators are comparable across companies and, over time, across the industry. Reporting cadence – leading indicators are most useful when assessed frequently, possibly monthly or quarterly, with lagging indicators appropriate to annual assessment or triggered by events.
Aggregation and governance – should a sector level score card be held by a regulatory body such as the FDA, industry group such as the IAFP, or a public/private initiative and if so, how should supplier data be protected yet still be used in the aggregation.
Pilot the scoring card: A scorecard like this should be pilot tested at one specific slice of business for instance fresh produce distribution before applying it across all business as the indicators will be tested against actual operational and actual outbreak data rather than assumes to generalize.
6. Conclusion
One lagging number (unemployment or annual recalls count) was never meant to bear the burden of evaluating system-health, and so food safety governance can stop expecting it too. By coupling operational leading indicators, completion of verification, time-to-corrective-action, root-cause recurrence, and migration to and among risk-tiers, with lagging outcome measures, like recall severity and reduction of illness, one captures an image that is much more authentic than either single number and recognizes the transparency and speedy response of an effective preventive system.
The tiered risk model presented below illustrates that the underlying data is probably already available within well-managed supplier verification programs; what has not been provided until now is a common language for interpreting it. This paper aims at launching this language as a first draft and invites further refinement by authorities, the food sector and the academic community.
Editor’s Note: the author, Santoshi Muriki, Food Safety and Quality Assurance Manager, Affiliated Foods is presenting “Building Risk‑Based Supplier Compliance Systems for FSMA 204 and Beyond: Automation, Analytics, and Culture” This session will walk participants through a practical, end‑to‑end approach to designing and operationalizing a modern supplier compliance program that meets FSMA 204 expectations while reducing manual workload and strengthening supply chain resilience. Food Safety Consortium Conference: Agenda.
Related Articles
-

The term, Normalization of Deviance has since become standard vocabulary in aviation safety, nuclear safety, and patient safety literature, precisely because the pattern keeps recurring: a known risk, documented, unresolved, tolerated because the bad outcome hasn't happened yet… until the…
-

Food safety audit failures repeat year after year because they're behavior problems, not protocol problems. The compliance gaps auditors document result from daily habits that erode under production pressure and unsupervised moments. Facilities that break the cycle invest in training…
-

FSTR is being launched in conjunction with its anchor research study: The Food Safety Digital Maturity Benchmark, giving food manufacturers an independent way to measure the impacts of digital transformation, technology adoption, and operational performance. The study findings will debut…
-

New award will recognize food and beverage organizations applying innovative technology to strengthen food safety performance
-

With so much confusion over the FDA’s FSMA food traceability requirements, companies need to begin considering standardization. This is especially true for companies with long supplier lines.
-

This series examines food safety as business infrastructure: the business decisions, governance structures, and operational conditions that determine whether technical food safety systems can hold under production pressure. The first three articles followed the record inward—from the corrective-action log, through…
