The Honey Trap: Analytical Technology Makes Food Fraud Easier to Catch

Because of its high nutritional value and distinctive flavor, natural honey is a premium product with a price tag significantly higher than that of other sweeteners. As a result, honey is often the target of adulteration using low-cost invert sugar syrups. This article looks at two analytical approaches based on isotope fingerprint analysis using isotope ratio mass spectrometry (IRMS) that can be used to detect honey adulteration and safeguard product integrity.
Honey is a complex mixture of sugars, proteins and other compounds, produced in nature by honeybees from flower nectar or honeydew. The extent to which its sugars are present is heavily dependent on the floral source and differs significantly between honeys produced in different regions. Climate, processing and storage conditions can also have an effect on the amounts of these sugars.1
Fructose and glucose are the major components of honey, and account for 85–95% of the total sugars present. The remaining carbohydrates are a mixture of disaccharides, trisaccharides, and larger oligosaccharides, which give individual honeys their own characteristic taste.
These distinctive flavors, combined with honey’s renowned nutritional benefits and a growing consumer demand for natural, healthy ingredients, have contributed to a substantial increase in honey sales over the past few decades. However, this demand has also helped to raise costs, with some varieties, such as Manuka honey, reportedly selling for as much as $35 for a 250 gm jar.
Just like many other food products that have a premium price tag, intentional adulteration is a significant concern for the honey industry. The fraudulent addition of cheaper sweeteners, such as sugar derived from cane, corn and beet sources, to extend product sales, is unfortunately common within the marketplace.
Honey producers and suppliers therefore require reliable and accurate analytical techniques to profile the composition of honey to identify cases of adulteration. Using analytical data, honey adulteration and counterfeiting can be routinely identified and product integrity can be maintained.
Carbon Isotope Fingerprints of Honey
Analysis of honey is commonly undertaken using isotope ratio mass spectrometry (IRMS) for the detection of adulteration. Honey has a fingerprint, a unique chemical signature that allows it to be identified. To visualize this fingerprint, IRMS can be used to identify the botanical origin of its constituent sugars.
Two ways that carbon can be incorporated into plants by photosynthetic CO2 fixation are the Calvin cycle (also known as the C3 cycle) and Hatch-Slack cycle (the C4 cycle). The nectar used by bees to produce honey comes from plants that produce sugars via the C3 pathway, while the sugars derived from sugar cane and corn are produced by the C4 pathway.
Carbon naturally exists as two stable isotopes that behave in the same way, but possess different atomic mass numbers. Carbon-12 is the most abundant in nature (98.9%), whereas carbon-13 is far less common (1.1%). By measuring the ratio of carbon-13 to carbon-12 (13C/12C) using IRMS, the carbon isotope fingerprint of the honey can be determined. As more carbon-13 is incorporated in sugars produced by the C4 pathway, the adulteration of honey with sugar cane and fructose corn syrups, rich in C4 sugars, can be detected.
In unadulterated honey, the carbon isotope fingerprint will be similar to that of the natural protein precipitated from the honey. However, if cane sugar or high fructose corn syrup has been added, the isotope fingerprint of honey and protein will be significantly different.
Detection of Adulteration by EA-IRMS
One approach that has traditionally been used for the detection of honey adulteration is elemental analysis interfaced with IRMS (EA-IRMS).2 This highly robust, rapid and cost-effective technique is able to reliably detect the addition of C4 sugars in honey at levels down to 7%.3 The analytical approach complies with the official method for the analysis of C4 sugars in honey, AOAC method 998.12.4
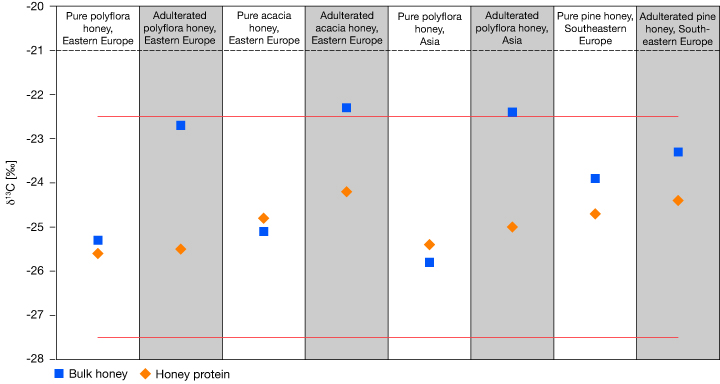
In EA-IRMS, bulk honey is combusted in the presence of pure oxygen to form CO2 for analysis. The CO2 produced from the combustion of the bulk honey, including all sugars and the protein fraction, is analyzed by IRMS. Figure 1 shows carbon isotope fingerprints of four unique samples, including bulk honey and the proteins extracted from those honeys, determined using an EA-IRMS system. In each case of adulteration, shown in the grey columns, the honey δ13C value becomes more positive relative to the protein value, moving towards the carbon isotope fingerprint of C4 plants. The natural variation of δ13C in honey is shown by the red lines.5
Detection of Adulteration by LC-IRMS
While EA-IRMS can be used to identify cases of honey adulteration using the bulk sample, the analysis of low levels of added C4 sugars and C3 sugars (i.e., beet sugars) to honey reveal that a compound specific technique with more powerful separation capabilities is needed. Furthermore, as fraudsters develop more sophisticated adulteration techniques and effective ways of concealing their actions, it can be necessary to utilize other IRMS techniques.
Much lower limits of adulteration detection can be obtained from liquid chromatography interfaced with IRMS (LC-IRMS). This technique permits the analysis of very small sample amounts without the need for extensive preparation or derivatization, and can also identify C3 sugar adulteration, which EA-IRMS cannot readily achieve, and therefore serves as a strong, complimentary isotope fingerprint technique. There are IRMS portfolios available that allow for sequential automated analysis of both analytical techniques.
Using LC-IRMS, the sample is oxidized within the aqueous solvent eluting from the HPLC column. The oxidation reagent consists of two solutions: The oxidizing agent itself and phosphoric acid. Both are pumped separately and added to the mobile phase. Within this mixture, all individual organic compounds eluting from the HPLC column are oxidized quantitatively into CO2 upon passing through a heated reactor. In a downstream separation unit, the generated CO2 is then separated from the liquid phase and carried by a stream of helium gas. The individual CO2 peaks in the helium are subsequently dried in an on-line gas drying unit and admitted to the isotope ratio mass spectrometer via an open split interface.
Continue to page 2 below.
One of the key benefits of LC-IRMS is the ability to determine carbon isotope fingerprints for each individual sugar component, comparable to EA-IRMS, which provides a carbon isotope fingerprint for all sugars in the honey. In this way, a comparison of δ13C of fructose and glucose, as well as the detection of other unknown sugars and the honey’s sugar pattern, can be determined within a single sample analysis. A representative LC-IRMS chromatogram for honey is shown in Figure 2.
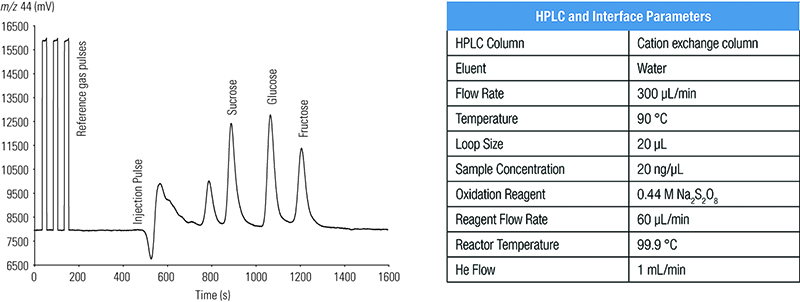
Table I reports data from eight honey samples analyzed using LC-IRMS and EA-IRMS to identify adulterated and unadulterated honey. A Thermo Scientific LC IsoLink IRMS System was used to analyze the honey samples in a comparative study with EA-IRMS.6 These data show that two cases of adulteration (Samples 1 and 5) were identified using EA-IRMS and four adulterated honeys (Samples 1, 2, 5, and 8) were detected using LC-IRMS.
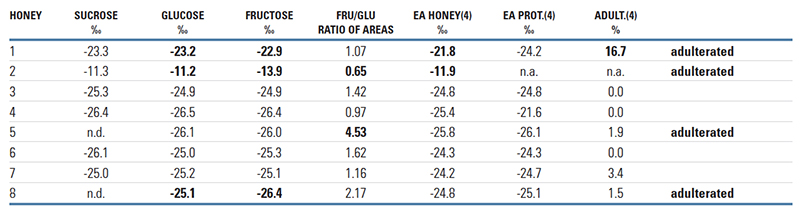
Despite exhibiting a normal fructose/glucose ratio of 1.07, honey sample 1 was suspected to be adulterated due to the less negative δ13C of the honey, relative to the protein. For honey sample 2, the significantly lower glucose content relative to fructose, and its resulting fructose/glucose ratio of 0.65 gives a clear indication of adulteration. Additionally, the 2.7‰ more negative δ13C value of fructose than glucose provides additional evidence to support this conclusion. Honey sample 5 is also adulterated, identified from the high fructose/glucose ratio of 4.53. Honey sample 8 was also identified as adulterated, from the difference of 1.3% in the δ13C values of glucose and fructose, as well as the high fructose/glucose ratio of 2.17. However, this conclusion could not be reached using the EA-IRMS data, as a δ13C difference of 0.3‰ (i.e., 1.5% adulteration with C4 derived sugar) is within the uncertainty of the method according to the AOAC method 998.12. However, the data clearly show that the combination of EA-IRMS and LC-IRMS can detect a wide range of honey adulteration, even at low levels, demonstrating the power of isotope fingerprints in detecting food adulteration.
Summary
EA-IRMS is a robust and proven technology for isotopic ratio measurement and can be used as a routine and reliable approach for the identification of honey adulteration, following the AOAC 988.12 official method. For low concentration adulteration, compound specific analyses using LC-IRMS benefits from enhanced analytical sensitivity and the ability to identify individual sugar isotope fingerprints. With adulteration a significant issue for honey manufacturers and suppliers, carbon isotope fingerprinting provides the industry with a powerful, robust and versatile solution to the challenge of safeguarding product integrity.
Continue to the sidebar on page 3 below: Follow the Honey: Safeguarding Food Integrity Using Integrated Informatics
Follow the Honey: Safeguarding Food Integrity Using Integrated Informatics
Manuka honey is a monofloral honey produced in New Zealand and Australia from the nectar of the manuka tree. It is purported to have a number of health benefits, which in recent years has been touted by celebrities and health-food gurus alike. Partly due to its star-appeal, manuka honey is amongst the most expensive honeys on supermarket shelves.
And it seems we can’t get enough of the stuff. An estimated 10,000 metric tons are consumed globally, according to figures from New Zealand’s Unique Manuka Factor Honey Association.7 However, with New Zealand’s manuka honey production set at just 1,700 metric tons annually, it’s clear that something suspicious is going on in the supply chain.
Manuka honey’s premium price tag and low market availability makes it a prime target for counterfeiters, who extend the product through adulteration with lower priced sugar syrups. This fraudulent activity has the potential to seriously damage consumer confidence and significantly impact sales revenues.
Action was needed to protect the interests of New Zealand’s manuka honey producers. A trade association for producers was established, and investment was made in establishing accredited methods that could be used to positively identify manuka honey. A standard set of properties and storage conditions required to prevent product degradation were defined to enable importers to verify the provenance of manuka honey using these analytical techniques.
Given the large volumes of data associated with large-scale honey analysis and the need for supply chain traceability, an integrated informatics solution can play a vital role in simplifying this process and safeguarding data integrity.
Identifying and quantifying specific components in a complex matrix such as honey requires both consistent preparation and reliable analysis techniques. Using a laboratory execution system (LES) to ensure analysis methods are followed according to standard operating procedures can help to deliver more reliable, consistent, and legally defensible results. Additionally, with analytical data stored securely within a centralized laboratory information management system (LIMS), and shared and accessed through a scientific data management system (SDMS), authorized users can conveniently retrieve and visualize data without logging into the original instrument – wherever they are in the food testing workflow. Paperless and integrated solutions like SampleManager LIMS, with built-in CDS, SDMS and LES, ensure that in the event of an audit or legal case, the data can be traced all the way from the analytical instrument right through to the analyst’s conclusion.
References
- O. Escuredo, et al. (2014). Contribution of botanical origin and sugar composition of honeys on the crystallization phenomenon. Food Chemistry, 149, 84–90.
- J.W. White. (1992). Journal of the Association of Official Analytical Chemists, 75, 543–548.
- J.F. Cotte, et al. (2007). Study and validity of 13C stable carbon isotopic ratio analysis by mass spectrometry and 2H site-specific natural isotopic fractionation by nuclear magnetic resonance isotopic measurements to characterize and control the authenticity of honey. Analytica Chimica Acta, 582, 125–136.
- Association of Analytical Communities (AOAC) official methods of analysis method 998.12: C-4 plant sugars in honey, internal standard stable carbon isotope ratio method. (1999). AOAC Int. Gaithersburg MD (USA) , Chap. 44, 27–30.
- L. Elflein and K.P. Raezke. (2008). Improved detection of honey adulteration by measuring differences between 13C/12C stable carbon isotope ratios of protein and sugar compounds with a combination of elemental analyzer – isotope ratio mass spectrometry and liquid chromatography – isotope ratio mass spectrometry (δ13C-EA/LC-IRMS). Apidologie, 39(5), 574–587.
- A. Cabañero, J.L. Recio, and M. Rupérez. (2006). Food Chemistry, 54, 9719–9727.
- S. Creasey. (2014). The great manuka honey swindle? The Grocer.
Related Articles
-

Get the latest on regulatory and GFSI requirements.
-
The handheld system features a new software platform, enhanced optical technology and wireless connectivity.
-

Providing practical and simple solutions are important when promoting adherence.
-

Food fraud has significant economic and public health implications, and companies should be prepared to go beyond FSMA requirements to confront the threat.

