
Because of its high nutritional value and distinctive flavor, natural honey is a premium product with a price tag significantly higher than that of other sweeteners. As a result, honey is often the target of adulteration using low-cost invert sugar syrups. This article looks at two analytical approaches based on isotope fingerprint analysis using isotope ratio mass spectrometry (IRMS) that can be used to detect honey adulteration and safeguard product integrity.
Honey is a complex mixture of sugars, proteins and other compounds, produced in nature by honeybees from flower nectar or honeydew. The extent to which its sugars are present is heavily dependent on the floral source and differs significantly between honeys produced in different regions. Climate, processing and storage conditions can also have an effect on the amounts of these sugars.1
Fructose and glucose are the major components of honey, and account for 85–95% of the total sugars present. The remaining carbohydrates are a mixture of disaccharides, trisaccharides, and larger oligosaccharides, which give individual honeys their own characteristic taste.
These distinctive flavors, combined with honey’s renowned nutritional benefits and a growing consumer demand for natural, healthy ingredients, have contributed to a substantial increase in honey sales over the past few decades. However, this demand has also helped to raise costs, with some varieties, such as Manuka honey, reportedly selling for as much as $35 for a 250 gm jar.
Just like many other food products that have a premium price tag, intentional adulteration is a significant concern for the honey industry. The fraudulent addition of cheaper sweeteners, such as sugar derived from cane, corn and beet sources, to extend product sales, is unfortunately common within the marketplace.
Honey producers and suppliers therefore require reliable and accurate analytical techniques to profile the composition of honey to identify cases of adulteration. Using analytical data, honey adulteration and counterfeiting can be routinely identified and product integrity can be maintained.
Carbon Isotope Fingerprints of Honey
Analysis of honey is commonly undertaken using isotope ratio mass spectrometry (IRMS) for the detection of adulteration. Honey has a fingerprint, a unique chemical signature that allows it to be identified. To visualize this fingerprint, IRMS can be used to identify the botanical origin of its constituent sugars.
Two ways that carbon can be incorporated into plants by photosynthetic CO2 fixation are the Calvin cycle (also known as the C3 cycle) and Hatch-Slack cycle (the C4 cycle). The nectar used by bees to produce honey comes from plants that produce sugars via the C3 pathway, while the sugars derived from sugar cane and corn are produced by the C4 pathway.
Carbon naturally exists as two stable isotopes that behave in the same way, but possess different atomic mass numbers. Carbon-12 is the most abundant in nature (98.9%), whereas carbon-13 is far less common (1.1%). By measuring the ratio of carbon-13 to carbon-12 (13C/12C) using IRMS, the carbon isotope fingerprint of the honey can be determined. As more carbon-13 is incorporated in sugars produced by the C4 pathway, the adulteration of honey with sugar cane and fructose corn syrups, rich in C4 sugars, can be detected.
In unadulterated honey, the carbon isotope fingerprint will be similar to that of the natural protein precipitated from the honey. However, if cane sugar or high fructose corn syrup has been added, the isotope fingerprint of honey and protein will be significantly different.
Detection of Adulteration by EA-IRMS
One approach that has traditionally been used for the detection of honey adulteration is elemental analysis interfaced with IRMS (EA-IRMS).2 This highly robust, rapid and cost-effective technique is able to reliably detect the addition of C4 sugars in honey at levels down to 7%.3 The analytical approach complies with the official method for the analysis of C4 sugars in honey, AOAC method 998.12.4
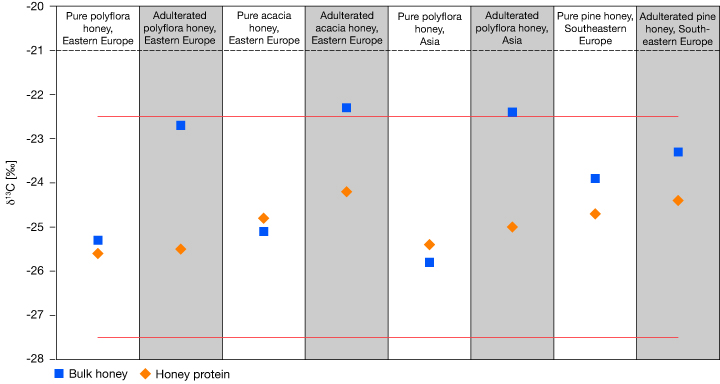
In EA-IRMS, bulk honey is combusted in the presence of pure oxygen to form CO2 for analysis. The CO2 produced from the combustion of the bulk honey, including all sugars and the protein fraction, is analyzed by IRMS. Figure 1 shows carbon isotope fingerprints of four unique samples, including bulk honey and the proteins extracted from those honeys, determined using an EA-IRMS system. In each case of adulteration, shown in the grey columns, the honey δ13C value becomes more positive relative to the protein value, moving towards the carbon isotope fingerprint of C4 plants. The natural variation of δ13C in honey is shown by the red lines.5
Detection of Adulteration by LC-IRMS
While EA-IRMS can be used to identify cases of honey adulteration using the bulk sample, the analysis of low levels of added C4 sugars and C3 sugars (i.e., beet sugars) to honey reveal that a compound specific technique with more powerful separation capabilities is needed. Furthermore, as fraudsters develop more sophisticated adulteration techniques and effective ways of concealing their actions, it can be necessary to utilize other IRMS techniques.
Much lower limits of adulteration detection can be obtained from liquid chromatography interfaced with IRMS (LC-IRMS). This technique permits the analysis of very small sample amounts without the need for extensive preparation or derivatization, and can also identify C3 sugar adulteration, which EA-IRMS cannot readily achieve, and therefore serves as a strong, complimentary isotope fingerprint technique. There are IRMS portfolios available that allow for sequential automated analysis of both analytical techniques.
Using LC-IRMS, the sample is oxidized within the aqueous solvent eluting from the HPLC column. The oxidation reagent consists of two solutions: The oxidizing agent itself and phosphoric acid. Both are pumped separately and added to the mobile phase. Within this mixture, all individual organic compounds eluting from the HPLC column are oxidized quantitatively into CO2 upon passing through a heated reactor. In a downstream separation unit, the generated CO2 is then separated from the liquid phase and carried by a stream of helium gas. The individual CO2 peaks in the helium are subsequently dried in an on-line gas drying unit and admitted to the isotope ratio mass spectrometer via an open split interface.
Continue to page 2 below.
Related Articles
-


Get the latest on regulatory and GFSI requirements.
-

The handheld system features a new software platform, enhanced optical technology and wireless connectivity.
-


Providing practical and simple solutions are important when promoting adherence.
-

Food fraud has significant economic and public health implications, and companies should be prepared to go beyond FSMA requirements to confront the threat.
which brands of honey or countries of origin of honey adulterate their product?