Food safety usually begins as a requirement: something regulators, customers, and certifiers expect before a product can be bought or sold. Responsibility for meeting their expectations is assigned inside the organization, but understanding food safety’s relationship to business decisions does not always move inside with it. This article explores what that disconnect asks of the people holding the responsibility, how it shows up at the interfaces between functions, and why it matters to profitability, risk, growth, and brand trust.
Nearly everyone in food safety has a gut-punch of a story, and we share them at networking events and conferences. It usually goes like this: a food safety decision was made outside their knowledge or control and the consequences landed in their lap, or they were pressured to go along with something they knew was not okay. Some left their jobs because of it. Some were let go. Most of the time, they were told this is just how it is and how it has always been done. But when a pattern is repeated across roles and organizations, it describes something more pervasive than any one person’s experience, and that deserves our attention.
A company’s first contact with food safety is as a condition of doing business. It must meet the requirements that allow it to produce and sell food, and those requirements establish controls, verification, documentation, and internal accountability. Inside the facility, people translate them into daily practice. The business depends on that translation, whether it recognizes the work as operating capability or treats it as something imposed from the outside.
The difficulty comes when responsibility for food safety is designated inside the organization but still treated as external to its operational priorities. When the authority, resources, and support to meet those requirements do not accompany that designation, Quality can be cast as the organization’s in-house regulator, not only carrying the responsibility for compliance but also absorbing the frustration the business feels toward rules it perceives as unnecessary and imposed on it from the outside. Compliance ends up positioned against production rather than as part of the operation’s ability to reliably meet customer expectations and produce safe food, and the people hired to hold that responsibility find themselves standing between the business and its own commitments. The familiar “food police” label captures that dynamic well. Treating Quality as the group that asks inconvenient questions, delays work, and enforces rules the business already agreed to follow separates those rules from the work and the people they are meant to protect.
The friction between compliance priorities and operational priorities is most often experienced when a decision has both food safety and business implications. Exploring reasonable paths forward is sound decision-making; however, intense organizational pressure can erode the support required to uphold standards, shifting the burden of unresolved risk onto individuals. The people entrusted with safeguarding food should never be pressured into ethical compromise.
Formal policies and programs set expectations, but the reality of an organization’s values is revealed by how it responds to issues raised under pressure. When the person who brought forward a concern is treated as an obstacle, people notice. When reported issues fail to produce meaningful action, they notice that too. Over time, they begin to weigh the value of speaking up against the personal cost. And when that cost is too high, problems remain hidden, systems weaken, and risk compounds. That is food safety culture, and it is learned by watching.
Much of this friction happens at the interfaces, the places where one part of the operation hands something to another: where Quality meets production, maintenance work triggers sanitation work, a concern has to travel up from the floor to someone who can act on it, and a sales commitment travels back down as a production and food safety demand the floor has to execute. Each function can be doing its part while responsibility, authority, information, and resources do not meet at the same point in the work. A decision made in one place can have consequences that land in another, often on people who were not part of the decision.
The people working at those interfaces see it first. Operators, sanitation, maintenance, and line supervisors know how the work is actually being done. They see when a written procedure and the realities of a shift conflict, when temporary repairs are failing, or when demand is stretching operations beyond what the system can reliably support. They can bring it forward in context, before risk or cost grows, but whether they do or not depends on what they have seen happen at that interface before.
When food safety is viewed as an expense imposed by third parties, or as a policing function, organizations lose sight of what it holds together. Many quality challenges stem from upstream decisions about equipment, scheduling, staffing, supply chain, and product design, yet their financial toll shows up in Quality’s budget. The expense view also misses the burden placed on the workforce and the risk carried by individuals. Much of what keeps the system stable lives in people: the reasoning behind specific controls, historical attempts at solutions, recurring pain points, and informal workarounds that have become standard practice. That dependence often goes unnoticed until the person whose mind it lives in leaves. When a business relies on an individual to sustain a system it hasn’t fully embraced, the value of that expertise, and its role in business continuity, only becomes clear once it’s gone.
The stories food safety professionals share describe a pattern, and a pattern gives a business reason to look more closely at the conditions it can change. Food safety as business infrastructure starts by backing the people, at every level, who carry it: asking whether those nearest the work can voice what they see, and whether that input reaches leaders empowered to act on it. Public health isn’t the only thing that depends on the answer. So do a company’s profitability, risk profile, growth trajectory, and brand reputation.
Imagine it’s July 21, 2028. The FDA contacts your site with a traceability request related to a contamination issue. You have 24 hours to provide data on the entire journey of a product through your supply chain, including your suppliers’ entire network.
This means you will need to answer a few questions. Do you know how your suppliers store their records? Do they use the same lot-code formats as you? Can they deliver their critical tracking events (CTEs) and key data elements (KDEs) in a way that is useful to your system?
If you can’t answer this with confidence, you’re not alone. But you are not prepared.
The Mistake Everyone Is Making with FSMA 204
The Food Safety Modernization Act (FSMA) was signed into law by President Obama in 2011 and celebrates its 15th anniversary this year. Section 204, the FDA’s Food Traceability Rule, takes effect on July 20, 2028. It calls for enhanced electronic recordkeeping for specific foods as they travel through the supply chain, including leafy greens, soft cheeses, shell eggs, fresh-cut produce and seafood. If any of these move through your network, you’ll be impacted. So will all of your suppliers.
The rule was originally set to take effect on January 20, 2026, but was extended to “ensure coordination between supply chain partners in order to fully implement the final rule’s requirements,” per the FDA. It cited industry feedback and a concern that trading partners lacked readiness, which points to a very real supplier network problem.
There are two big mistakes manufacturers are making with FSMA 204. The first is assuming that because you’re FSMA-compliant, you’ll be compliant with Section 204. The second is thinking about the rule as an internal issue that can be solved with better recordkeeping.
When the FDA shows up with that traceability request, you’ll be expected to provide an electronic sortable spreadsheet with key details within 24 hours. In order for you to obtain that information quickly – and in the correct format – your suppliers and vendors will also need to be in compliance with the rules.
The 24-Hour Rule: The Creeper Threat
What you, as a quality leader, should be most concerned about isn’t whether you’re capturing the right data (that’s a no-brainer), but whether you can access data from wherever it is in the supply chain, within 24 hours.
So let’s break down what this looks like in the real world: A manufacturer has to contact a co-packer who contacts a raw material supplier who needs to find a lot code in a spreadsheet or legacy ERP system, that may not even be compatible with our system, and you have to do it in 24 hours. That’s an extremely short window.
The financial impact, meanwhile, is massive. The FDA lacks the authority to impose fines directly, but can pursue federal civil or criminal actions if noncompliance is persistent. The greater risk, however, is losing your supplier status with major retail partners – many of which are mandating compliance before enforcement.
The Dirty Little Secret: Data Fragmentation Across Your Network
The uncomfortable truth about supplier networks in food manufacturing is that they weren’t built for this level of complexity. They have evolved, supplier by supplier, system by system. Most operate as a patchwork of disconnected ERPs, spreadsheets, and paper logs. Each node in that network may be capturing traceability data, but almost none of it is shared in a way that easily connects to the next node.
This is really what FSMA 204 is getting at: not whether you’re prepared internally, but how consistently your supply chain as a data-sharing network is performing. Those who will be most challenged won’t be companies that haven’t invested in compliance (many have). It will be those who have invested in their internal operations, but have not extended that effort to their supply networks. The moment the FDA begins tracking, the weakest link in your data chain becomes your biggest liability.
Warehouse worker in protective clothing operating a pallet jack, moving stock within a large, low-temperature cold storage facility
What “Ready” Actually Looks Like
True FSMA 204 readiness requires three interconnected elements, all of which must happen simultaneously, not in sequence.
Full chain traceability. All CTEs in your network must be identified and associated with the corresponding KDEs, from farm to fork. Your traceability system must extend beyond your four walls to create a seamless record that connects your supplier data with your own.
For manufacturers, a critical factor will be to establish a community of suppliers all speaking the same data language, capable of automatically transmitting data to one another error-free.
A rapid recall response is a must. The 24-hour clock isn’t about meeting a deadline for paperwork, it’s a litmus test for operational efficacy. Your quality teams must be able to achieve instant traceback and traceforward without manually combing through supplier emails.
To achieve this, you’ll need a single source of truth where all documentation is readily accessible, lot codes are automatically associated, and automatic notifications are triggered the moment a potential issue arises, all before the FDA ever knocks on the door. That way you can manage proactively and maintain continuity.
The Window Is Narrowing
July 2028 may seem like a long way off, but it’s closer than you think. Interoperability across an entire supply chain takes time, and getting your organization completely aligned on new data standards and traceability is a monumental undertaking that will require significant time and effort.
Companies that don’t take action now, and instead push the problem off until next year, will find themselves in a world of hurt when 2028 rolls around and they still aren’t prepared. Plus, many major retailers are requiring early and expanded compliance, so you’ll want to make sure you’re aligned with the expectations of your customers.
The question now isn’t if you should start preparing. It’s whether you’re preparing for the right things.
We’ve just experienced the Summer of Food Recalls. A number of high-profile, widespread incidents caused consumers to worry about the safety of our food supply. People are questioning whether the industry is doing enough to protect public health. Businesses are feeling the impact.
While it feels like we had more food recalls than usual this summer, the number of recalls is actually on par with recent years. However, the recalls are getting biggerandmore complex. Fewer, larger suppliers are serving more points of sale, which is why a single contamination event can have such a massive impact. As we saw this summer, lettuce contaminated with Cyclospora and jalapeños contaminated with Salmonella impacted products across the nation. Both were international suppliers with wide distribution.
Cyclospora outbreaks are nothing new. They’re cyclical and tend to occur during the hot, humid summer months. The scope and scale of the outbreaks are the story’s headline. Longer, international supply chains are unlocking new complexity levels. The industry must learn to manage crises of this magnitude.
Key learnings from this summer’s recalls include:
We can’t stop recalls completely, but we can improve the way we prepare for them. Despite advances, innovations, and prevention strategies within the industry, some food safety breaches and subsequent recalls remain inevitable. Food businesses must become more resilient and better prepared to manage these situations. Resilient supply chains prepare in advance so they’re ready to act quickly and properly during a recall. Develop a recall plan that can guide your team during a stressful, chaotic incident. Train your staff on recall protocols. Practice recall simulations collaboratively with your trading partners. Ensure that employees and partners feel prepared to handle any recall situation.
International supply chains increase complexity. Cross-border sourcing complicates data management. As ingredients move through multiple companies, countries, and regulatory jurisdictions, it becomes more challenging to identify, trace, and contain contaminated products. Knowing your supply chain—and working collaboratively with them—helps prevent, contain, and resolve recalls. This is especially important as supplier consolidation and distribution complexity directly impact recall scale.
Say the right things at the right time. Looking back on the Cyclospora outbreak provides key insights on what not to do, communication-wise, during a recall. Information was incomplete, vague, and confusing, driving consumer fear about the safety of all produce. Communication was slow, as investigators tried to pinpoint the source of the massive outbreak. In hindsight, we understand why it took so long to identify the source. Cyclospora symptoms are often delayed by days or weeks, which complicated the investigation and made it more challenging to pinpoint the source. However, confusion is the enemy of a well-run recall. This situation demonstrated that fast, clear communication matters, even if the situation is still evolving. Explain what you know immediately, then provide real-time updates as they become available.
Reiterate your commitment to food safety. Consumers are collectively nervous about the safety of the American food supply. This is understandable after the numerous recalls—lettuce, jalapenos, eggs, blueberries, etc.—we’ve just experienced. Consumers need reassurance that the industry is taking every possible precaution to keep food safe. This is a good time to reiterate your commitment to food safety. Explain that you’re continuously focused on this issue, and you’ll always prioritize strict, effective food safety protocols.
Rely on tech solutions. As supply chain complexity increases and recall scale continues to grow, data management is even more critical. Data management determines how well a recall is managed, contained, and resolved. The most effective, accurate way to manage recall data is through integrated tech systems. When trading partners use interoperable systems for data sharing, it enables better visibility and traceability, faster action, more targeted recalls, and less risk for supply chains and their customers.
Standardize data and systems now. Unfortunately, we still lack standardized data and systems industry-wide. The good news is that the industry is working on this, but the bad news is that progress is slow. Notably, enforcement of FSMA 204 has been delayed until July 2028. Despite this delay, food businesses across the chain must start building and implementing integrated systems now to improve recall management. Doing so will improve traceability, visibility, info-sharing, transparency, accuracy, and communication—which are all vital to proper recall management.
While we can’t prevent all food recalls, we can improve the way we prepare for and manage these incidents. Key takeaways from this summer—like preparing in advance, communicating quickly, understanding the complexities of international supply chains, and relying on integrated tech tools—will help your company become more resilient. As we’ve seen repeatedly, resilient supply chains are better equipped to manage today’s complex recalls, minimize damage, and protect public health.
Severe weather can increase stored product pest risks in food and beverage processing facilities by damaging building protections, disrupting routine sanitation, inspection and monitoring practices as well as causing an increase in stored product pest activity. While severe weather does not create stored product pest risks by itself, storm-related damage and operational disruptions can make existing pest activity harder to detect and manage and create conditions that are conducive to pest activity and survival.
Maintaining the processes we can control is essential. By reviewing the facility’s integrated pest management (IPM) program before storm season and verifying that protections remain in place afterward, processors can help protect ingredients, maintain audit readiness and prevent stored product pest activity from complicating recovery.¹ ² ³
Key Takeaways for Food and Beverage Processing Facilities
Stored product pests can threaten dry goods, ingredients and packaged products throughout the year.³ ⁴
Severe weather can disrupt stored product pest habitats and facility protections, while operational disruption can create gaps in routine pest prevention.¹
Pest management should be incorporated into a facility’s Pest Prevention Pre-Requisite as part of its FSMA Food Safety Plan.²
Pre-storm planning and post-storm inspections can help facilities identify changes before stored product pest activity becomes harder to manage.¹ ³
How Does Severe Weather Increase Pest Risk in Food Processing Facilities?
Severe weather can increase stored product pest risks in food processing facilities by damaging structural protections, disrupting sanitation and monitoring routines, and changing outdoor conditions for stored product pests. For food and beverage processors in regions that face severe weather during the fall, pest prevention should remain part of preparation and recovery planning. Extreme weather can damage building materials and affect windows, roofs, machinery, cold-storage areas or HVAC systems. When outdoor stored product pest habitats are disturbed, these pests may also move toward commercial structures for shelter.¹
Stored product pests are a year-round risk within the supply chain, with higher pressures during warmer months and severe weather events. They may already be present in ingredients, packaging, incoming shipments or overlooked areas of a facility. When severe weather disrupts normal operations, existing stored product pest activity may be more likely to go unnoticed. Long periods of rainfall followed by extreme heat or cold can also lead to an abundance of stored product pests.¹ ⁴ ⁵
During recovery, attention naturally shifts to property repairs and revised shipping or receiving logistics. If routine sanitation, inspections or monitoring are delayed, a small stored product pest issue may remain unnoticed longer than it otherwise would, allowing stored product pest infestations to grow within the facility.
Why Should Pest Control Be Part of a Pest Prevention Pre-Requisite?
In food and beverage processing facilities, a Pest Prevention Pre-Requisite is the structured pest management program used to help prevent, monitor, document and respond to pest activity as part of the facility’s FSMA Food Safety Plan. This approach treats pest control as an ongoing food safety program integral to facility operations.²
An evidence-based IPM program within a facility’s Pest Prevention Pre-Requisite defines how the facility prevents pest activity through cGMPs, monitoring, documentation and pest management. It connects the work of the pest management provider with facility practices such as sanitation, building maintenance, ingredient storage and employee reporting. Monitoring data, action thresholds and escalation plans can then guide the response when activity is detected through preventive control measures outlined in the plan.² ³ Orkin’s Food Safety Precision Protection™ program integrates pest prevention, monitoring, documentation and corrective action into a customized IPM approach designed to support food safety and audit readiness. As a national provider with local expertise, highly trained Orkin Pros can support multiple facilities after severe weather hits with consistent, reliable service.
The prerequisite also provides continuity when severe weather changes normal operations. Before storm season, facility teams can review known vulnerabilities, confirm monitoring procedures and determine how pest prevention practices will continue if storage or receiving processes change. After an event, the program provides a framework for recording damage, evaluating new conditions and verifying that existing protections are still effective.
What Are Stored Product Pests?
Stored product pests are insects that infest or feed on food-grade ingredients, commodities and goods as well as packaged food products in food processing plants and storage environments. Common examples include Indian meal moths, flour beetles, grain beetles and rice or granary weevils. These pests can enter packaging, contaminate or damage inventory and create compliance or operational concerns for food processing facilities.³ ⁴ Stored product pests cause significant adulteration and financial losses by contaminating food, causing products to be unfit for the supply chain.
The ingredients handled within a facility influence the types of pests it may encounter. Grain, cereal and flour products can be vulnerable to dry process stored product pests, such as several beetles and weevils. Nuts, dried fruit, spices and confections commonly attract warehouse beetles, cigarette beetles, drugstore beetles or Indian meal moths. Stored product beetles and moths may also infest green coffee, cocoa, chocolate and candy products.⁴
Signs of activity can appear in the food itself or in nearby storage and processing areas. Small, round exit holes in grain may indicate weevils or burrowing larvae of beetles and moths. Flour beetle activity can contribute to discoloration or an unpleasant odor. Indian meal moths may leave webbing in food products, while mature larvae may move onto walls or ceilings to pupate into the next generation of adult moths.⁴
The location where an insect is observed may not reveal where the problem began. Stored product pests can remain hidden in damaged packaging, older inventory or accumulations of grain dust. Product residue around conveyor rollers and transfer points can provide additional food and shelter. Spillage is a constant struggle to manage through sanitation, but spills are a critical source of resources for stored product pests. Stored product pests can also enter a facility through raw ingredient shipments or travel to other locations through the supply chain.⁴ ⁵
How to Help Prevent Stored Product Pests Before and After Severe Weather
1. Inspect and Restore Physical Pest Protections
Inspect the building before storm season, paying attention to windows, screens, roofs, gutters, exterior materials, HVAC areas and utility penetrations. Areas that may not usually raise concerns can become weak spots that give pests an opening along the building exterior. Work with your pest control provider and facility maintenance team to inspect all areas and address any existing damage to the facility’s exclusion measures, such as door sweeps and dock levelers. ¹ ⁵
After severe weather events, partner with facilities engineers to conduct a thorough inspection of the building’s integrity, looking for any signs of damage like standing water, air movement and light penetration in areas where it should not occur. These should be addressed immediately, even if temporary repairs are in place while a comprehensive facilities repair plan is developed. Clean up any standing water and debris that may have entered the facility right away. Re-establishing effective sanitation and exclusion measures can greatly limit stored product pest threats. 1 5
2. Protect Ingredients and Packaged Products
Maintain best practices for ingredient storage after a severe weather event, particularly when products have been moved or storage areas have been affected.¹
Store products above floor level and provide enough space around inventory to support inspection.
Protect vulnerable grains and flour products by storing them in airtight containers when appropriate.
Prevent older products from remaining undisturbed for extended periods by following first-in, first-out practices.⁴ ⁵
Inspect incoming goods for pests and signs of pest activity.
Keep doors closed between shipments.¹ ⁵
Ensure the building is as secure as possible just before the weather event.
Pest management professional should inspect ingredient storage areas and provide recommendations to help prevent stored product pests. Image courtesy of Orkin
3. Maintain Sanitation and Moisture Controls
Maintaining sanitation and moisture control is critical to pest management, including stored product pests. Clean spills promptly and remove buildup around conveyor lines, transfer points and areas under or behind equipment. Even small amounts of residue can provide food for stored product pests.⁴ ⁵ In a post-storm audit, identify any areas where outdoor debris entered the facility and have these areas cleaned as soon as possible.
Moisture should also be limited. Remove standing water, inspect machinery for mold or mildew and check cold-storage areas for water accumulation. Leaking pipes, floor drains and produce-washing areas can support other pest pressures and create additional food safety concerns.¹ ⁴
4. Verify Monitoring and Response Procedures
Monitoring can help facilities identify patterns in pest activity, locate the source of issues and know whether treatments are working. After a severe weather event, verify that the monitoring program remains intact, especially where inventory or equipment was moved. Your pest control professional should conduct a full audit of the facility’s IPM plot plan to ensure that all equipment is still in place and functioning properly. Employees should also know how to report pest sightings or signs of pests like webbing, damaged packaging, exit holes in grain or unusual changes in a product’s appearance or odor.³ ⁴
Stored product pest programs may use species-specific pheromone or sticky traps to detect activity. Monitoring findings should be evaluated against established action thresholds and escalation plans so that responses reflect the pest species and level of activity observed.³ In the aftermath of a weather event, any unusual pest activity should be documented, and immediate preventive controls should be put in place to eliminate introduced stored product pests before they become established in the plant.
5. Document Changes and Coordinate With Partners
Documentation is an essential part of keeping food and beverage processing facilities audit-ready. Facilities should maintain a pest sighting log that records the date and time of each sighting, the pest identified and the actions taken in response. To provide a complete picture during an audit, each sighting should be paired with documentation showing the corrective measures implemented. If any changes are enacted in the equipment monitoring system, they should be reflected in an updated IPM plot plan for the facility.
Facilities should also keep detailed service reports from their pest management provider. These reports should document signs of pest activity, site vulnerabilities such as cracks or water leaks, the corrective actions taken and verification that those actions effectively resolved the issue. Together, pest sighting logs and service reports help support an audit-ready Pest Prevention Pre-Requisite. Digital reporting tools such as Orkin InSite®, which provides a comprehensive view of a facility’s pest management program in a convenient online dashboard, including any changes to the IPM plot plan, can help organize and maintain these records and support audit readiness.² ³
Schedule a post-storm inspection with the pest management provider to confirm that preventive measures remain effective. Coordination with shipping partners and building contractors can also help prevent temporary recovery measures from weakening the Pest Prevention Pre-Requisite.¹ ³
How Can Proactive Pest Management Help Food Processors Prepare for Storm Season?
The pest prevention pre-requisite of the Food Safety Plan is designed upon the foundation of proactive pest management. Proactive pest management as part of a pre-requisite program can help food processors prepare for severe weather by identifying structural vulnerabilities, reviewing stored product pest risks and establishing how essential prevention practices will continue if operations are disrupted.
After a storm, a coordinated inspection can determine whether building damage, moisture, relocated inventory or revised receiving procedures require changes to the IPM program. Documentation should reflect those findings and the corrective actions taken in response. Don’t forget to update the plan, along with validation documentation, for any corrective actions taken.
Severe weather may contribute to structural damage that creates gaps in a facility’s exclusion measures. Credit: Orkin Commercial
This approach helps keep pest management integrated into the facility’s food safety plan as part of the pest prevention prerequisite. By planning proactively and reassessing controls after severe weather, food and beverage processors can protect themselves against a range of pest pressures while reducing the chance that a year-round stored product pest risk becomes an additional recovery challenge.
Frequently Asked Questions About Stored Product Pests and Severe Weather
What are stored product pests? Stored product pests are insects, including certain beetles, weevils and moths, that target dry goods, ingredients and packaged food and food-related products. They can damage or contaminate inventory in food processing and storage environments.³
Does severe weather cause stored product pest infestations? Severe weather does not cause stored product pest infestations, but it can damage facility protections, affect pest environments and disrupt a facility’s routine prevention practices. Stored product pests are a year-round risk.¹ ³
What food products are most vulnerable to stored product pests? Grains, cereals, flour, nuts, dried fruit, spices, chocolate and other confections can attract different stored product pest species. The risk depends on the commodities, ingredients and finished products in a facility and how they are stored.⁴
What are common signs of stored product pest activity? Warning signs may include webbing, insects in or around products, small exit holes in grain, damaged packaging, discoloration or unusual odors. Indian meal moth larvae may also appear on walls or ceilings.⁴
How are stored product pests monitored? Pest management programs may use pheromone or sticky traps designed for specific pests. These stations are documented in an IPM plot plan and data is tracked for trend analysis. Monitoring data can be compared with action thresholds and escalation plans to guide an appropriate response.³
The annual number of food recalls is a common way to judge the performance of the food safety system, but it is just as likely an increase is caused by improving data and communication capabilities as by worsening safety. This reflects the same trade of central bankers faced decades ago: No single, backward-looking stat tells a policy maker or an industry participant if a given system is healthy or in imminent failure today. The Fed doesn’t run the economy using solely the unemployment rate; instead, it monitors multiple leading and concurrent statistics so it can take pre-emptive action while a downturn can be “confirmed” in any single widely followed metric.
Here we propose just such a dual scoreboard, comprised of leading and lagging statistics taken from actual operations and the system’s output — as expressed through recall and outbreak incidents. The work is the first application of the concepts on top of a tier approach to supplier risk employed throughout a multi-supplier grocery distribution system and presented as a launch pad for further industry and regulatory comment.
1.The Problem with a Single Headline Number
When recall numbers get high there are two possible stories. One is that contamination, the nature of them is getting worse, there are more of them, they are being handled less responsibly. The second story is that your processes are working. It should be this, testing, verification of your supplier, tracking and a really rigorous verification program that catches a contamination at the receiving warehouse instead of at a retailer or finally when consumers get it home and this fact (which you are providing with a verifiable test that caught it before the goods got into the warehouse), it really should be incentivized.
However, if this contamination that you detected before the product gets into the warehouse causes an increase to a recall numbers that the consumer is seeing as failure, then you have incentivized that program to not detect the contamination, not perform the tests and so it has made your score look good on a single index scorecard, but you are actually not safe.
This isn’t just an imagined worry. If across the 1,000+ supplier network, one thing is universally reported in operations it is this: if the number of nonconformances increases, the most frequent response is that enforcement and inspections are improving rather than that the food supply is becoming riskier. Using the recall count on its own to indicate the health of a system undermines the visibility we are trying to engineer with preventative programs.
2. A Monetary Policy Analogy
Central bankers hit a variant of this a while back. Because inflation and unemployment are outcome measures-confirmable only after the fact and capable of revision-a policy regime anchored solely by them would be a policy regime always reacting to yesterday’s economy. For this reason, the Federal Reserve maintains what is now quite a long basket of measures, including leading indicators such as new orders, credit spreads and labor market churn, alongside the lagged outcome measures, so that policy can act on expected instead of confirmed economic conditions. No single number is being asked to bear this crucial burden alone.
Neither regulatory food safety governance nor in-company governance has always been as reliant on this discipline as it should be. Recall numbers and outbreak case counts are lagged outcome indicators, like an unemployment rate: they point out that a problem was experienced long after the operational decisions creating it were made. No system governed solely by examining these metrics will do anything but run the equivalent of an emergency room from 2007 to 2015.
3. A Paired Scorecard: Leading and Lagging Indicators
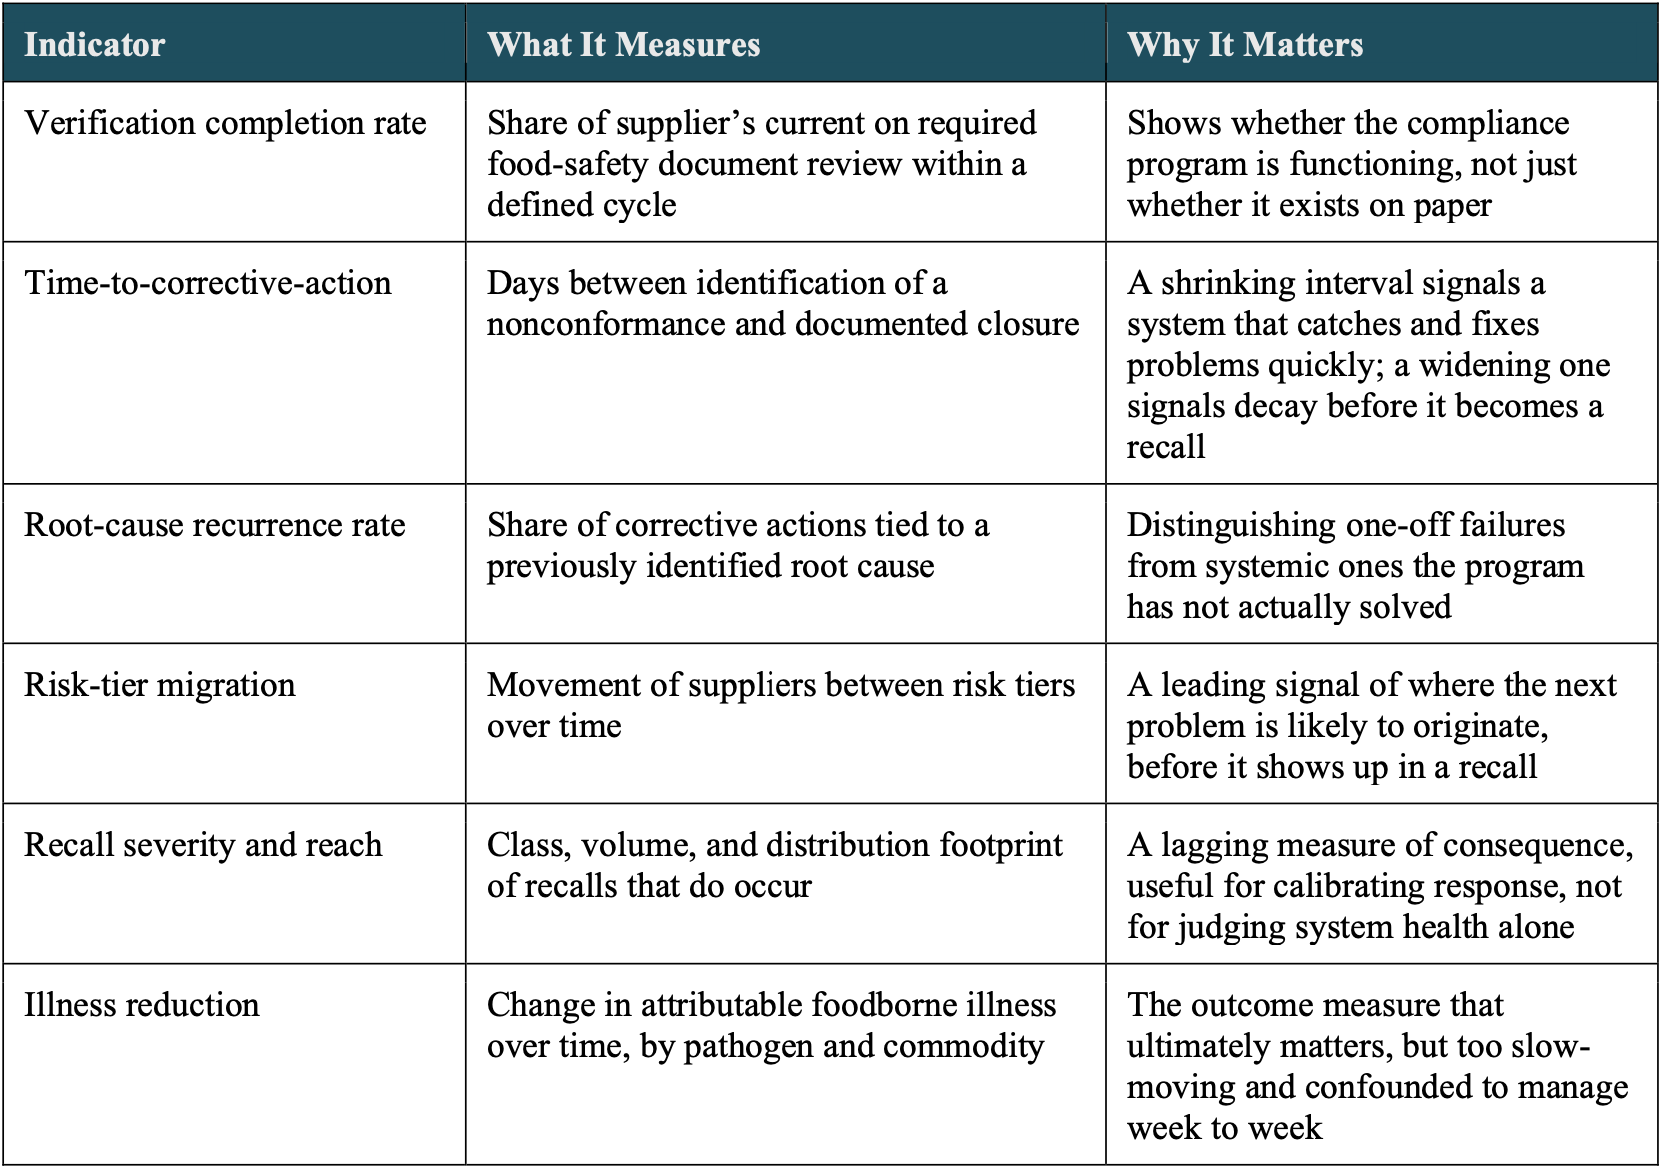
Here, we present a framework which links operational leading indicators, describing the day-to-day functioning of a prevention and verification system with lagging outcome indicators, describing what did or did not actually reach the consumer Table 1 shows an initial set of indicators derived from our experience in managing supplier compliance at scale.
Table 1.
No single row in Table 1 is sufficient on its own. A high verification completion rate plus an increasing root-cause recurrence rate would signal a program that is great at paperwork but poor at fixing the issues it is discovering. A decreasing time-to-corrective-action plus a flat risk-tier migration rate would signal a system that is neither catching problems nor making sure that those problems are mitigated. The power of framework is in reading those metrics as a body just as the federal reserve may look at prices, employment and credit data together instead of separately
4. Grounding the Framework in a Tiered Risk Model
The approach is not entirely theoretical. It builds on a risk-based tiered supplier compliance model designed to oversee compliance for a vast and diverse supplier population for food safety assurance, because one cannot scale manually or with a one size-fits-all verification process on one size of suppliers. The supplier. tiering is based on categories of products provided, previous compliance record and specific product hazards – and varies the frequency and rigor of documentation review accordingly. Deployment of that system realized significant operational improvements to include drastic reductions in manual follow-up, greatly reduced supplier onboarding times, and 100 percent compliance with required food-safety documentation.
Those tiering mechanisms also produce much of the raw data required for a leading-indicator scorecard: total tier verification completion, total time-to-corrective-action by tier and change in tier over time for suppliers. A national or sector-level scorecard would require less new data capture than that already produced by good supplier verification programs – including those that will exist under the FSMA Food Traceability Rule and those required under GFSI benchmarks.
5. Toward Implementation
A move from concept to action will require consensus on a handful of open questions, presented here as a point for discussion rather than a closed case. Definitions and denominators – how to come to consensus on what constitutes a ‘supplier,’ a ‘verification,’ and a closed ‘corrective action’ so that indicators are comparable across companies and, over time, across the industry. Reporting cadence – leading indicators are most useful when assessed frequently, possibly monthly or quarterly, with lagging indicators appropriate to annual assessment or triggered by events.
Aggregation and governance – should a sector level score card be held by a regulatory body such as the FDA, industry group such as the IAFP, or a public/private initiative and if so, how should supplier data be protected yet still be used in the aggregation.
Pilot the scoring card: A scorecard like this should be pilot tested at one specific slice of business for instance fresh produce distribution before applying it across all business as the indicators will be tested against actual operational and actual outbreak data rather than assumes to generalize.
6. Conclusion
One lagging number (unemployment or annual recalls count) was never meant to bear the burden of evaluating system-health, and so food safety governance can stop expecting it too. By coupling operational leading indicators, completion of verification, time-to-corrective-action, root-cause recurrence, and migration to and among risk-tiers, with lagging outcome measures, like recall severity and reduction of illness, one captures an image that is much more authentic than either single number and recognizes the transparency and speedy response of an effective preventive system.
The tiered risk model presented below illustrates that the underlying data is probably already available within well-managed supplier verification programs; what has not been provided until now is a common language for interpreting it. This paper aims at launching this language as a first draft and invites further refinement by authorities, the food sector and the academic community.
Editor’s Note: the author, Santoshi Muriki, Food Safety and Quality Assurance Manager, Affiliated Foods is presenting “Building Risk‑Based Supplier Compliance Systems for FSMA 204 and Beyond: Automation, Analytics, and Culture” This session will walk participants through a practical, end‑to‑end approach to designing and operationalizing a modern supplier compliance program that meets FSMA 204 expectations while reducing manual workload and strengthening supply chain resilience. Food Safety Consortium Conference: Agenda.
While we are in the middle of another massive food recall exercise, many people are dreading having to implement a food traceability system as designed by the FDA in response to Food Safety Modernization Act requirements. The FDA, after smoking some whacky weed, has burdened the food industry with a “well thought out” set of traceability rules. Currently being delayed due to a lack of understanding, some traceability rules must surely be devised and implemented prior to the demise of the FDA regardless of how burdensome they might be.
The Goal: Create and tie lot codes to Key Data Elements (KDEs) at Critical Tracking Events (CTEs).
Food traceability is critical to the survival of innocent companies and products when the recall monster raises its head.
With so much confusion over the FDA’s FSMA food traceability requirements, companies need to begin considering standardization. This is especially true for companies with long supplier lines.
Take for instance tomato sauce. Boiled tomatoes may have salt, basil, garlic and other ingredients added during the cooking process and prior to bottling and labeling the sauce. The FDA Food Traceability List below includes tomatoes and fresh herbs (basil, parsley and garlic) that are, in this case, input in a raw form prior to the cooking process. All require identification of the specific harvest location, time and traceability lot number and all fall within traceability requirements. From harvest, through cooling, into sorting, etc. these ingredients must be tracked. A hundred cases of tomatoes harvested from the same field on the same day may be divided and shipped to five or more locations including distribution centers, stores or a farmer’s market.
For the tomato sauce under consideration, a kill step (cooking) is involved meaning that these Food Traceability List (FTL Table 1) ingredients no longer need to be tracked under their original lot tracking number. A new lot number is generated and tied to the original tracking numbers after the cook (blend) step.
It gets confusing and difficult early in the life of the tomato sauce.
The Food Traceability List
Food Traceability List
Description
Cheeses, other than hard cheeses, specifically:
Cheese (made from pasteurized milk), fresh soft or soft unripened
Includes soft unripened/fresh soft cheeses. Examples include, but are not limited to, cottage [1], chevre, cream cheese, mascarpone, ricotta, queso blanco, queso fresco, queso de crema, and queso de puna. Does not include cheeses that are frozen or previously frozen, shelf stable at ambient temperature, or aseptically processed and packaged.
Cheese (made from pasteurized milk), soft ripened or semi-soft
Includes soft ripened/semi-soft cheeses. Examples include, but are not limited to, brie, camembert, feta, mozzarella, taleggio, blue, brick, fontina, monterey jack, and muenster. Does not include cheeses that are frozen or previously frozen, shelf stable at ambient temperature, or aseptically processed and packaged.
Cheese (made from unpasteurized milk), other than hard cheese[2]
Includes all cheeses made with unpasteurized milk, other than hard cheeses. Does not include cheeses that are frozen or previously frozen, shelf stable at ambient temperature, or aseptically processed and packaged.
Shell eggs
Shell egg means the egg of the domesticated chicken. Includes products (whether fresh or frozen) that contain raw, unpasteurized eggs as ingredients.[3]
Nut butters
Includes all types of tree nut and peanut butters. Includes all forms of nut butters, including shelf stable, refrigerated, frozen, and previously frozen products. Examples include, but are not limited to, almond, cashew, chestnut, coconut, hazelnut, peanut, pistachio, and walnut butters. Does not include soy or seed butters.
Cucumbers (fresh)[4]
Includes all varieties of fresh cucumbers.
Herbs (fresh)
Includes all types of fresh herbs. Examples include, but are not limited to, parsley, cilantro, and basil. Herbs listed in 21 CFR 112.2(a)(1), such as dill, are exempt from the requirements of the rule under 21 CFR 1.1305(e).
Leafy greens (fresh)
Includes all types of fresh leafy greens. Examples include, but are not limited to, arugula, baby leaf, butter lettuce, chard, chicory, endive, escarole, green leaf, iceberg lettuce, kale, red leaf, pak choi/bok choi, Romaine, sorrel, spinach, and watercress. Does not include whole head cabbages such as green cabbage, red cabbage, or savoy cabbage. Does not include banana leaf, grape leaf, and leaves that are grown on trees. Leafy greens listed in § 112.2(a)(1), such as collards, are exempt from the requirements of the rule under § 1.1305(e).
Leafy greens (fresh-cut)[5]
Includes all types of fresh-cut leafy greens, including single and mixed greens.
Melons (fresh)
Includes all types of fresh melons. Examples include, but are not limited to, cantaloupe, honeydew, muskmelon, and watermelon.
Peppers (fresh)
Includes all varieties of fresh peppers.
Sprouts (fresh)
Includes all varieties of fresh sprouts (irrespective of seed source), including single and mixed sprouts. Examples include, but are not limited to, alfalfa sprouts, allium sprouts, bean sprouts, broccoli sprouts, clover sprouts, radish sprouts, alfalfa & radish sprouts, and other fresh sprouted grains, nuts, and seeds.
Tomatoes (fresh)
Includes all varieties of fresh tomatoes.
Tropical tree fruits (fresh)
Includes all types of fresh tropical tree fruit. Examples include, but are not limited to, mango, papaya, mamey, guava, lychee, jackfruit, and starfruit. Does not include non-tree fruits such as bananas, pineapple, dates, soursop, jujube, passionfruit, Loquat, pomegranate, and sapodilla. Does not include tree nuts such as coconut. Does not include pit fruits such as avocado. Does not include citrus, such as orange, clementine, tangerine, mandarins, lemon, lime, citron, grapefruit, kumquat, and pomelo. Tropical tree fruits listed in § 112.2(a)(1), such as figs, are exempt from the requirements of the rule under § 1.1305(e).
Fruits (fresh-cut)
Includes all types of fresh-cut fruits. Fruits listed in § 112.2(a)(1) are exempt from the requirements of the rule under § 1.1305(e).
Vegetables other than leafy greens (fresh-cut)
Includes all types of fresh-cut vegetables other than leafy greens. Vegetables listed in § 112.2(a)(1) are exempt from the requirements of the rule under § 1.1305(e).
Finfish (fresh, frozen, and previously frozen), specifically:
Finfish, histamine-producing species
Includes all histamine-producing species of finfish. Examples include, but are not limited to, tuna, mahi mahi, mackerel, amberjack, jack, swordfish, and yellowtail.
Finfish, species potentially contaminated with ciguatoxin
Includes all finfish species potentially contaminated with ciguatoxin. Examples include, but are not limited to, grouper, barracuda, and snapper.
Finfish, species not associated with histamine or ciguatoxin
Includes all species of finfish not associated with histamine or ciguatoxin. Examples include, but are not limited to, cod, haddock, Alaska pollock, salmon, tilapia, and trout.[6] Siluriformes fish, such as catfish, are not included.[7]
Smoked finfish (refrigerated, frozen, and previously frozen)
Includes all types of smoked finfish, including cold smoked finfish and hot smoked finfish.[8]
Crustaceans (fresh, frozen, and previously frozen)
Includes all crustacean species. Examples include but are not limited to shrimp, crab, lobster, and crayfish.
Molluscan shellfish, bivalves (fresh, frozen, and previously frozen)[9]
Includes all species of bivalve mollusks. Examples include, but are not limited to, oysters, clams, and mussels. Does not include scallop adductor muscle. Raw bivalve molluscan shellfish that are (1) covered by the requirements of the National Shellfish Sanitation Program; (2) subject to the requirements of 21 CFR part 123, subpart C, and 21 CFR 1240.60; or (3) covered by a final equivalence determination by FDA for raw bivalve molluscan shellfish are exempt from the requirements of the rule under § 1.1305(f).
Ready-to-eat deli salads (refrigerated)
Includes all types of refrigerated ready-to-eat deli salads, including ready-to-eat deli salads that are frozen at some point in the supply chain prior to retail. Examples include, but are not limited to, egg salad, potato salad, pasta salad, and seafood salad. Does not include meat salads.
The tomato paste company must train and establish data input requirements for all suppliers and must assure that each supplier is in traceability compliance. Compliance requires that each supplier and the tomato sauce company are all capable of supplying the FDA lot traceability data when any recall occurs. The FDA, in turn, must store (electronic record keeping) take that data (spread sheet or whatever form) from all sources and somehow establish a traceability path.
The FDA cannot do that. Someone must wonder how all this will eventually work.
The Need for Some Standardization
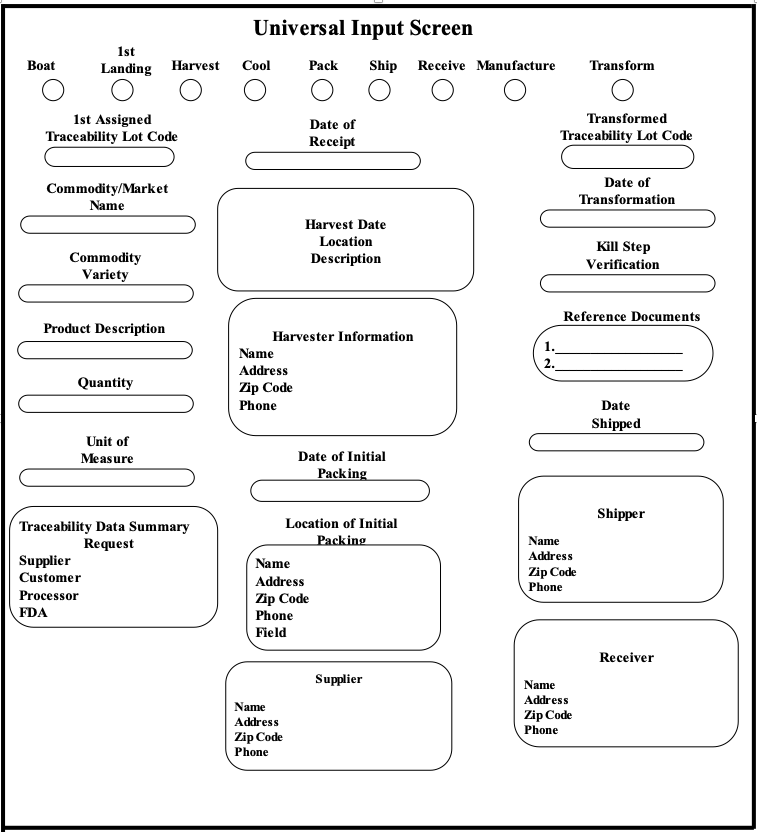
If you study the FDA FSMA Food Traceability requirements for any period of time, you will notice how similar requirements are repeated. This repetition provides a basis for standardization. Given a relatively large processor company with perhaps hundreds of suppliers and dozens of final products, the need to control and guide those suppliers in a consistent manner arises if any semblance of food traceability is to result. Take for example the concept put forth by the illustration below. A “Universal Input Screen” (Figure 1) sets the scene for entering food traceability data (in compliance with FDA rules) from any place in the supply chain.
Figure 1
By checking on the “Harvest” link at the top of the screen, the farm can enter data to record date, time location, lot number, product name/description, quantity, unit of measure, variety, name, and packing or cooling information. The harvester can also record the shipper and date shipped, location of packing and other data.
Likewise a producer can, by clicking on the “Manufacture” button enter data relative to receipt from, transformation, new lot number, kill step (including date, verification and reference documents.)
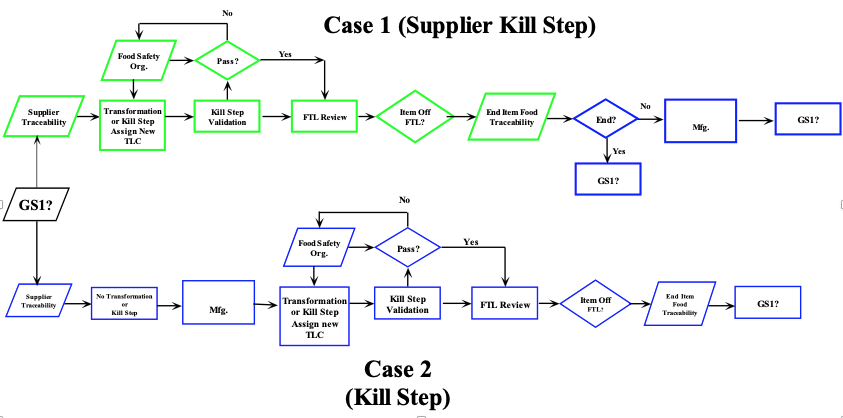
If required, other input screens can be developed to incorporate such things as GS1 requirements or data (Figure 2). GS1 identities are in use for hundreds of food products and many companies are in need of incorporating them into their own traceability systems.
In Case 1, the supplier has a kill step for a GS1 product in their process that ends traceability for the item prior to hand off to the parent production facility. In case 2 only the parent facility has a kill step. In both instances, maintenance and hand-off of GS1 identities is critical.
Figure 2 GS1 and Kill Steps
The system can be programmed so that whenever a “Critical Tracking Event” occurs, Key Data Element data may be entered and controlled by a smart programmer who sets up controls to only allow required data for any event. For example, if the “Harvest” button is enabled, any data entry for “Transformation” would be unenabled.
Other controls can be established such as date checks, traceability lot number verification or comparison to Food Traceability List requirements.
Standardizing the use of a system like this would establish a single Traceability Plan for all suppliers as well as the parent company. The ability to supply the FDA or any traceability effort would be available by entering a request using the “Traceability Data Summary Request” button. Fast, simple and allows the computer to do the work. Reduces response time to a minimum and maybe even saves lives and money. That’s what food traceability should do.
Grain receiving lines process millions of tons of raw material each year, serving as the first critical defense against fungal contamination. Oversights at this entry point can trigger costly rejections and irreversible health consequences when toxins infiltrate production runs. Mycotoxin test accuracy at the receiving stage determines whether contaminated grain enters the supply chain or is intercepted before reaching consumers.
The Growing Threat of Fungal Contamination in Cereal Production
The Food and Agriculture Organization estimates that 25% of cereal products globally harbor mycotoxins, though actual figures likely climb higher with varying detection standards and limit thresholds. When screening protocols fail to catch tainted batches, product quality deteriorates as compromised grain enters manufacturing streams. Entire harvests then face rejection or disposal, reducing food availability.
Fungal diseases also cause economic devastation, reducing cereal yields by 15% to 20% annually, though severe outbreaks can eliminate up to half of a harvest. Wheat growers absorbed particularly devastating losses in 2019 when fungal diseases claimed 22% of the global yield. Every percentage point of lost production translates to millions in unrealized revenue.
Environmental Factors Driving Fungal Spread
Storage environments create ideal conditions for rapid mold proliferation and toxin production when grain is at water activity levels between 0.90 and 0.995 and temperatures range from 15° to 25° Celsius — 59° to 77° Fahrenheit. Warmer conditions between 20° and 28° C specifically accelerate zearalenone production by Fusarium graminearum. This temperature sensitivity means seasonal fluctuations directly impact toxin accumulation rates in stored commodities.
Research across multiple agroecological zones identified 986 fungal isolates, with Aspergillus species accounting for 42.87% of the total, while Fusarium ranked second at 33.50%. An accurate aflatoxin test for grain becomes essential where Aspergillus thrives, while processors in Fusarium-prone regions prioritize detecting deoxynivalenol and zearalenone.
Financial Toll of Mycotoxins on the Agricultural Economy
Grain operations across the United States absorb nearly $932 million annually from crop losses and tainted harvests. Regulatory enforcement, verification infrastructure and quality control measures add another $466 million to prevent compromised products from reaching markets.
These combined expenses reach nearly $1.4 billion annually, ultimately affecting commodity prices throughout the supply chain. The economic impact extends internationally as inconsistent mycotoxin standards between nations create trade barriers that reduce international commerce and limit market access for grain exporters.
Harmonizing global verification requirements could unlock more than $6 billion in additional trade for cereals and nuts. Processors maintaining rigorous protocols at receiving lines position themselves to meet the strictest international benchmarks and capture premium market opportunities.
Overcoming Challenges in Mycotoxin Detection and Quality Control
Operations meeting compliance rely on detection technologies far more sophisticated than traditional methods, which lack the necessary speed and sensitivity. One study shows that combining multiplex polymerase chain reaction and liquid chromatography with tandem mass spectrometry allows rapid and accurate detection of mycotoxigenic species across large volumes while maintaining precision.
These advanced methods must meet rigorous regulatory standards. The U.S. Department of Agriculture (USDA) Federal Grain Inspection Service requires three separate analysts to extract seven distinct samples during validation trials. At least 95% of test results from these 21 total extractions must fall within acceptable ranges.
Kits are also evaluated using naturally contaminated corn at targeted aflatoxin concentrations of 5.0, 20, 100 and 300 parts per billion. Only systems delivering precise results across this concentration spectrum earn FGIS approval.
Implementing Accurate Testing Solutions for Regulatory Compliance
Fungal infiltration risks extend beyond storage areas into finished consumer products. According to biotechnology company Charm Sciences, “Mycotoxin organisms entering the manufacturing process of baked goods can adversely affect human health and reduce shelf-life. These concerns are becoming more prevalent as demand increases globally for more whole-grain usage.”
Recognizing these downstream implications, quality control managers prioritize precision at every checkpoint. To meet this need, industry leaders like Charm develop systems certified to mandatory USDA Federal Grain Inspection Service standards. This certification ensures diagnostic tools achieve the sensitivity required for regulatory thresholds while maintaining the exactness international buyers demand. Ultimately, these tests provide manufacturers with the assurance that their grains are safe to use as raw materials in production.
Operations equipped with FGIS-approved systems reduce the risk of false negatives that allow tainted grain to enter production streams and compromise mycotoxin test accuracy.
Best Practices for Securing Receiving Lines and Storage
Preshipment documentation should include harvest dates, storage conditions and previous screening results. Visual inspection provides the first alert when discolored kernels or musty odors signal fungal activity, while representative sampling from multiple shipment points captures toxins that concentrate unevenly.
Once stored, automated sensors enable quality teams to pinpoint conditions that favor fungal growth before contamination develops. Immediate corrective action becomes essential when readings approach critical thresholds, and grain rotation prevents batches from sitting long enough for mold to proliferate. Detailed records of conditions, results and actions support continuous improvement.
Frequently Asked Questions
The same questions arise consistently when quality control managers evaluate contamination risks and develop prevention strategies. Clear answers help processing centers implement more effective protocols.
Why is fungal contamination a major concern for grain receiving lines? Receiving lines are the final checkpoint before grain enters production systems, so toxins that pass through at this stage can affect entire batches and force costly recalls. Health hazards from mycotoxin exposure remain largely irreversible, making prevention at the point of entry essential for protecting consumers and maintaining brand reputation.
How does mycotoxin contamination impact the agricultural economy? Direct crop losses in the United States exceed $930 million annually, while regulatory compliance and verification add nearly $470 million in additional costs. International trade also faces barriers due to inconsistent benchmarks across nations, though operations that maintain rigorous screening avoid these losses and access premium markets that demand verified quality.
An accurate aflatoxin test for grain becomes a competitive advantage rather than simply a compliance requirement.
What are the most effective methods for detecting mycotoxins? Advanced molecular techniques combined with analytical procedures deliver both speed and precision for high-volume operations. Systems must meet USDA Federal Grain Inspection Service criteria, requiring that 95% of results fall within acceptable ranges across multiple analysts and concentration levels.
Certified solutions provide the sensitivity needed to detect toxins at regulatory thresholds while processing samples quickly enough to avoid bottlenecks at receiving lines.
Safeguarding the Future of Grain Handling
Receiving line vigilance remains the most cost-effective strategy for preventing toxins from entering the food supply. Investment in systems that meet rigorous regulatory criteria protects operations from costly recalls while ensuring the mycotoxin test accuracy buyers demand. Quality control begins with the first sample at the receiving dock.
The food service industry has undergone significant transformation since the COVID era, and few innovations have evolved as rapidly as the rise of ghost kitchens. Whether operating as delivery-only restaurants, virtual brands, commissary kitchens, multi-branded sites, or shared commercial kitchen spaces, ghost kitchens have allowed for new opportunities for food entrepreneurs while simultaneously introducing unique food safety and traceability challenges.
As regulators, customers, and supply chain partners continue to increase their focus on transparency and traceability, ghost kitchen operators must understand how food safety responsibilities apply to their business and where risks may exist within their operation. While the operating model may be different, the food safety expectations remain the same.
What is a Ghost Kitchen?
A “ghost kitchen” is generally defined as a food preparation facility that produces meals for off-premises consumption, often through third-party delivery platforms, without a traditional dine-in experience.
These operations can take several forms, including:
Single-brand delivery-only restaurants.
Virtual restaurant brands operating out of existing restaurants.
Centralized production kitchens supplying multiple delivery concepts.
Hybrid models supporting both retail and delivery operations, which may or may not include virtual or branded concepts.
While these models offer operational flexibility, reduced overhead costs, and open the opportunity to significant new revenue streams, they also create additional complexity when it comes to supplier management, ingredient traceability, allergen control, and recall readiness.
Why Traceability Matters in Ghost Kitchens
Traditional restaurants often have relatively straightforward ingredient flows. Ingredients arrive, are prepared, served, and consumed at a single location.
Ghost kitchens, however, frequently involve multiple brands operating from one facility with shared storage areas and preparation equipment, common ingredients used across several menu concepts, a variety of delivery providers, and central commissaries supplying multiple locations.
This complexity increases the importance of maintaining accurate records that identify:
What ingredients were received
Which suppliers provided them
When products were received
How products were used
Which menu items contained those ingredients
Where finished products were distributed
Enhanced requirements outlined within FDA’s FSMA 204 regulations.
Without adequate traceability records, identifying affected products during a food safety incident can become extremely difficult.
Supplier Approval is More Important Than Ever
Many ghost kitchen operators focus heavily on speed and convenience when sourcing ingredients. However, rapid growth can sometimes outpace supplier verification processes.
An effective supplier approval program should include:
Approved supplier lists
Supplier food safety documentation
Third-party audit verification
Certificates of Analysis (COA) when appropriate
Ingredient specifications
Recall and crisis management procedures.
This becomes particularly important when multiple virtual brands rely on common ingredients. A single supplier issue may impact numerous menu offerings simultaneously.
The Recall Challenge for Ghost Kitchens
One of the most significant food safety concerns for ghost kitchens is recall execution.
Imagine a scenario where a contaminated ingredient is used across six virtual restaurant brands operating within the same facility. The affected ingredient may have been incorporated into dozens of menu items sold through multiple delivery platforms over several weeks.
Questions operators must be able to answer include:
Which supplier provided the ingredient?
What lot codes were received?
Which menu items contained the affected ingredient?
Which brand(s) utilized the ingredient?
During what dates the ingredient was used?
How much inventory remains on-site?
The ability to answer these critical questions rapidly can significantly reduce the scope of a recall and help protect consumers.
The Missing Ingredient: Connected Information
One of the biggest misconceptions about traceability is that organizations simply need better software. In reality, most ghost kitchens already have technology. They use procurement systems, inventory platforms, POS systems, kitchen management software, supplier portals, delivery applications, and food safety systems.
The challenge isn’t that the information doesn’t exist. The challenge is that it often lives in disconnected systems owned by different organizations.
A single meal may involve ingredients from multiple suppliers, inventory managed in one application, orders placed through another, delivery fulfilled by a third-party platform, and customer information maintained somewhere else entirely. During a food safety event, operators must quickly connect those pieces together.
The future of traceability in foodservice won’t be defined by replacing existing systems. It will be defined by connecting them, allowing information to move securely between suppliers, operators, delivery partners, and customers while each continues using the technology that best supports its business.
FSMA 204 and Ghost Kitchens
The FDA’s Food Traceability Rule (FSMA Rule 204) has largely focused industry attention on additional traceability requirements for foods appearing on the Food Traceability List (FTL). While many ghost kitchens may not fall directly under all aspects of FSMA 204, operators should pay close attention to how their suppliers and supply chain partners are implementing enhanced traceability systems.
As traceability requirements expand throughout the food industry, businesses that maintain strong receiving records, inventory controls, and ingredient tracking systems will be better positioned to meet customer, regulatory, and supply chain expectations. Many ghost kitchens already utilize digital ordering and inventory management platforms, making them well-positioned to leverage technology for improved traceability. The opportunity isn’t simply to digitize more processes. It’s to ensure the information already being captured can be shared quickly with trading partners, customers, and regulators when needed. Traceability becomes significantly more valuable when it moves beyond compliance and supports day-to-day operations, supplier collaboration, and faster decision-making.
Food Security in Mind
Ghost kitchens frequently receive orders and pickups from multiple delivery services and this can significantly increase food security risks.
Challenges often include:
unknown drivers and companies
different requirements for handling
multiple menu concepts using different handling expectations, or,
food packaged in a way that does not protect it from adulteration
Companies should implement processes that protect food during transit from the ghost kitchen to the customer. This often includes tamper evident packaging, external packaging, and other deterrents that limit driver access.
Looking Ahead
Ghost kitchens represent an exciting evolution within the foodservice industry, but they are not exempt from the food safety responsibilities required of their traditional counterparts. In many ways, the complexity of shared facilities, virtual brands, and centralized production models makes robust food safety and traceability programs even more important.
As consumer expectations for transparency continue to increase and regulatory requirements evolve, ghost kitchen operators that invest in supplier management, traceability systems, allergen controls, and recall readiness will be better positioned to protect their customers and their brands.
The question is no longer whether traceability matters in foodservice. The question is whether your operation can quickly identify where ingredients came from, where they were used, and what actions need to be taken when something goes wrong.
Food safety audit failures are behavior problems, not protocol problems. According to AIB International,1 the most common audit findings share a consistent thread: employees who know the correct protocols but don’t consistently follow them. Facilities don’t fail because they lack documentation. They fail because employees abandon protocols when deadlines are tight, supervisors are elsewhere, and shortcuts seem harmless.
FDA inspections occur every 3-5 years.2 The behaviors that cause failures happen every day.
The Top Audit Failure Patterns
AIB International’s research1 identifies the most frequent audit failures as employee behavior issues:
Pest activity from inconsistent monitoring and program follow-through
Inadequate cleaning when staff rush or abbreviate procedures
Pesticide and chemical control lapses from untrained handling or off-label use
Food safety plan gaps when documented procedures aren’t followed
Equipment and utensil issues from deterioration and neglected maintenance
Each of these looks like a knowledge gap. It isn’t. Employees know what the protocols require. The problem is consistent follow-through under real conditions.
Why More Training Won’t Fix This
Compliance training teaches information, not habits.
Research on habit formation3 shows that building automatic behaviors takes approximately 10 weeks of consistent practice. Most compliance programs compress everything into a few hours or days—nowhere near the timeline required for lasting behavior change. The forgetting curve compounds the problem:4 without reinforcement, most training content is gone within a month.
Facilities fix the immediate violation, update documentation, and wait for the next audit. Without changing the underlying behaviors, the same findings resurface.
That’s not a training failure. It’s a design failure.
Embedding Safety Into Daily Work
Lasting compliance requires training that builds habits during actual operations, not separate training events.
Rather than pulling employees out for classroom sessions, an effective approach delivers short, specific practice activities during regular work. Consider chemical storage compliance. Instead of a presentation on protocols, an employee receives an activity like: “During your next chemical walkthrough, verify that every chemical in your area is stored in its correct location and labeled properly. If anything is out of place, correct it and document what you found before you leave the area.”
The activity takes less than a minute to understand. It creates immediate practice under the exact conditions where protocol adherence eventually breaks down. That authentic context is what builds habits that persist when no supervisor is present.
Personalization helps produce genuine behavior change, not just checkbox exercises. Research on behavioral skill development5 consistently shows that relevance to an employee’s actual role and work environment dramatically improves adoption. A line supervisor needs activities around monitoring and escalation. A maintenance technician needs activities integrating safety checks into repair tasks. A new hire needs foundational activities. An experienced worker needs activities addressing complex scenarios. Generic training treats everyone the same. Effective training doesn’t.
For inadequate cleaning, an activity might be: “Before signing off on your next sanitation log, walk the line and verify one piece of equipment yourself before you sign—not after. Note whether it met the standard or needed attention.”
These activities require no additional equipment or scheduling. They happen during work employees already do, with intentional focus on the specific behaviors that prevent audit failures.
Measuring What Actually Matters
Completion rates and test scores don’t predict audit performance. Behavior change does.
Before launching a training initiative, establish baseline measurements by surveying both employees and their direct supervisors. Ask specific questions about the frequency of safety behaviors, confidence following procedures under production pressure, and understanding of why each protocol matters. After a sustained practice period, repeat those same assessments and compare.
Supervisor observations provide the most valuable validation. When shift leaders report that employees complete monitoring steps without prompting, maintain storage compliance between audits, and finish documentation on their own, you’re capturing the Level 3 behavior change that directly predicts audit outcomes. Connect those behavioral improvements to results: track violations across audit cycles, measure the frequency of repeat findings, and document the time required for corrective actions.
Compliance as Competitive Advantage
Audit failures are expensive. Beyond the audit and re-audit fees themselves, facilities absorb the cost of remediation, corrective documentation, and business disruption—and the deeper cost is the cycle that repeats when daily behaviors don’t change.
Facilities that break that cycle gain something beyond avoided costs. Following protocols consistently reduces incidents, accelerates certifications, and builds a workforce that treats compliance as automatic rather than effortful. Your employees already know what they should do. Give them the practice they need to do it consistently.
Most food safety culture assessments still lean on annual surveys and self-reported audit responses — snapshots of what people say, taken once or twice a year. Supplier compliance behavior tells a more current story: how fast a vendor answers a document request, how often the same corrective action keeps coming back, and how long a supplier sits in an at-risk tier before anything changes. This article lays out a practical way to read that behavior as a culture signal, based on firsthand work redesigning a risk-tiered supplier verification system across a network of more than 1,000 suppliers.
The Blind Spot in How We Measure Culture
Food safety culture finally has a seat at the leadership table. GFSI’s latest position paper defines culture as the shared values, behaviors, awareness of risks and organizational learning that should be measurable and continuously improved, not just part of crisis communication1. That’s progress. The problem? The tools most organizations use to measure food safety culture haven’t kept up with the definition.
Ask any quality team how they’re measuring culture, and you’ll get some variation on a survey: a yearly questionnaire, a maturity scale, an audit-tied score, a self-assessment. These tools are valuable in many ways, but they all suffer from the same structural limitation. They offer a snapshot of the present, and a representation of what someone has been encouraged to claim, not a reliable indicator of their past and future behavior.
One recent systematic review of food safety culture questionnaires found that respondents can suffer from lack of time or clarity to provide valid responses, and that survey questionnaires capture biased accounts rather than the actual behaviors they purport to represent2. Other industry experts and researchers have voiced the exact same concern about survey results, pointing out that they represent recency bias and can create an impression of a food safety culture that differs from a company’s long-term, lived reality3.
This isn’t to say these instruments are useless. It simply means they answer a more specific, and often more limited, question than they are often perceived to answer. They provide insights into a food safety organization’s intentions or public image. They do not accurately or reliably assess what happens in a food supply chain when no one is there to fill out a form.
Behavior Is Harder to Fake Than a Survey Answer
This is where it all goes off the rails: Many existing compliance platforms are already leveraging a treasured trove of behavioral data on an ongoing basis, and it has zero to do with a survey. Supplier verification programs generate tons of it, as a matter of course.
Under the FSMA Foreign Supplier Verification Programs rule, for example, importers are expected to assess risk and performance on a continued basis and to maintain verification records,4 but regardless of whether the rule applies to a particular supplier, there is an underlying obligation that drives exactly the kind of evidence a culture survey never can: a history-complete with timestamps-of how a supplier acts when it is called to task in compliance.
That history might include things such as: How long it takes for a supplier to respond to an information request (e.g. Requesting an updated COA, corrective action response, and updated specification). Whether it appears to take two rounds of corrective action on a single nonconformance issue. How long does a supplier remain in at-risk status before its rating changes. Whether a serious incident is resolved before it becomes a near-miss or an open hold.
These aren’t opinions; they are objective records that the supplier produces because it had to, not because anyone asked a question that someone felt obliged to answer honestly.
Table 1 below shows how to interpret those kinds of signals and what happens typically when you don’t.
What This Looked Like in Practice
One of the most useful first observations we had during the process of redesigning an automated, risk-tiered system for verification of a supplier network of over 1,000 suppliers was entirely unrelated to tiering logic itself. This was an observation related to the movement (or lack thereof) of suppliers through the system over time.
A few of our suppliers seemed to continually generate the exact same corrective action, closed and reopened using slightly different phrasing. In terms of system reporting, each of these corrective actions were closed. The underlying problem is that it is simple as an allergen changeover step or a labeling control never actually gets fixed. It wasn’t reflected by tier status because our current tiering is dependent on the open/closed status of the corrective action, not the recurrence of the same underlying cause.
Once we began to also track the recurrences – a single nonconformance code against a single supplier within a specified period of time – we observed a pattern, not necessarily derivable from a survey: there was a select group of suppliers with a disproportionate number of recurrences, and a select group of suppliers which seemed to be consistently slower at responding to basic document requests than the remainder of the network. These two are not two different issues; they’re just two perspectives of the same underlying behavior.
This reframe altered the escalation process significantly; instead of escalating a supplier after a single audit or missed document request deadline, they now escalate automatically, prior to the hold, because they have two correlated issues.
From Lagging to Leading: Making the Shift
This difference matters because most food safety teams’ already existing metrics are backward-looking, they measure what’s already happened. Complaint totals and audit scores don’t predict whether we failed. Data from audits, complaints, and recalls tell us about the past, not what’s next5. They don’t give warnings about repeated mistakes.
Conversely, leading indicators were designed to signal what’s about to happen6. And supplier behavior is among the most readily available, and currently ignored, sources of leading intelligence organizations possess without purchase.
This shift in practice is achievable without new software. It just requires a new attitude toward the information organizations already possess:
Instead of, “Has the corrective action been closed?” the questions becomes, “Have these specific nonconformances ever come up for this supplier before-and if so, how often?”
Instead of, “What’s the supplier’s current tier?” the question is, “How long has the supplier been in this tier-is this time frame unusual?”
Instead of, “Was the audit finding addressed?” the question is, “How long has the closure of these findings taken relative to what other suppliers take on these same issues?”
Instead of, “Was the escalation resolved?” the question is, “What did it take for resolution to happen-and did that resolution occur before or after the occurrence of a near-miss?
These aren’t complex questions. Many compliance systems have this information at their disposal; it just is not being pulled to highlight trends because the reporting mechanisms were created to track status, not behavior.
Culture Shows Up in the Data You Already Have
Your survey is how you learn what your organization and its suppliers think about food safety, one to two times a year. Your supplier’s compliance behavior is what they do, day in and day out, because of the verification activity that is mandated by everyone anyway. It does not replace a culture survey, root cause analysis or a GFSI-based framework – it gives them an earlier, less easily “gamed” input signal.
The suppliers who get ahead of food recalls related to suppliers, usually aren’t those who had the most eloquently written survey.
They usually are the organizations who recognized a trend in response times, frequency and tier status, many months before a lab or customer alert became the warning. They aren’t just sitting there in some database; someone simply failed to connect the dots as culture, not forms.
References
Global Food Safety Initiative. “A Culture of Food Safety,” Position Paper, Version 2.0. GFSI, March 26, 2026.
Wang, Y., et al. “Measuring Food Safety Culture: A Systematic Review of Questionnaire Dimensions and Validation Practices.” Comprehensive Reviews in Food Science and Food Safety, 2026.
Alliance to Stop Foodborne Illness. “Assessing Food Safety Culture: What Works Best?” stopfoodborneillness.org, March 2026.
U.S. Food and Drug Administration. “FSMA Final Rule on Foreign Supplier Verification Programs (FSVP) for Importers of Food for Humans and Animals.” FDA.gov.
LRQA. “Food Safety Performance Indicators.” LRQA.com, March 23, 2022.
SafetyChain. “Food Safety KPIs: The Six Leading Indicators.” SafetyChain.com, June 4, 2026.
FoodSafetyTech. “Effective Root Cause Analysis for CAPA Management.” FoodSafetyTech.com, Dec. 5, 2023.
This website uses cookies so that we can provide you with the best user experience possible. Cookie information is stored in your browser and performs functions such as recognising you when you return to our website and helping our team to understand which sections of the website you find most interesting and useful.
Strictly Necessary Cookies
Strictly Necessary Cookies should be enabled at all times so that we can save your preferences for these cookie settings.
We use tracking pixels that set your arrival time at our website, this is used as part of our anti-spam and security measures. Disabling this tracking pixel would disable some of our security measures, and is therefore considered necessary for the safe operation of the website. This tracking pixel is cleared from your system when you delete files in your history.
We also use cookies to store your preferences regarding the setting of 3rd Party Cookies.
If you visit and/or use the FST Training Calendar, cookies are used to store your search terms, and keep track of which records you have seen already. Without these cookies, the Training Calendar would not work.
If you disable this cookie, we will not be able to save your preferences. This means that every time you visit this website you will need to enable or disable cookies again.
Cookie Policy
A browser cookie is a small piece of data that is stored on your device to help websites and mobile apps remember things about you. Other technologies, including Web storage and identifiers associated with your device, may be used for similar purposes. In this policy, we say “cookies” to discuss all of these technologies.
Our Privacy Policy explains how we collect and use information from and about you when you use This website and certain other Innovative Publishing Co LLC services. This policy explains more about how we use cookies and your related choices.
How We Use Cookies
Data generated from cookies and other behavioral tracking technology is not made available to any outside parties, and is only used in the aggregate to make editorial decisions for the websites. Most browsers are initially set up to accept cookies, but you can reset your browser to refuse all cookies or to indicate when a cookie is being sent by visiting this Cookies Policy page. If your cookies are disabled in the browser, neither the tracking cookie nor the preference cookie is set, and you are in effect opted-out.
In other cases, our advertisers request to use third-party tracking to verify our ad delivery, or to remarket their products and/or services to you on other websites. You may opt-out of these tracking pixels by adjusting the Do Not Track settings in your browser, or by visiting the Network Advertising Initiative Opt Out page.
You have control over whether, how, and when cookies and other tracking technologies are installed on your devices. Although each browser is different, most browsers enable their users to access and edit their cookie preferences in their browser settings. The rejection or disabling of some cookies may impact certain features of the site or to cause some of the website’s services not to function properly.
Individuals may opt-out of 3rd Party Cookies used on IPC websites by adjusting your cookie preferences through this Cookie Preferences tool, or by setting web browser settings to refuse cookies and similar tracking mechanisms. Please note that web browsers operate using different identifiers. As such, you must adjust your settings in each web browser and for each computer or device on which you would like to opt-out on. Further, if you simply delete your cookies, you will need to remove cookies from your device after every visit to the websites. You may download a browser plugin that will help you maintain your opt-out choices by visiting www.aboutads.info/pmc. You may block cookies entirely by disabling cookie use in your browser or by setting your browser to ask for your permission before setting a cookie. Blocking cookies entirely may cause some websites to work incorrectly or less effectively.
The use of online tracking mechanisms by third parties is subject to those third parties’ own privacy policies, and not this Policy. If you prefer to prevent third parties from setting and accessing cookies on your computer, you may set your browser to block all cookies. Additionally, you may remove yourself from the targeted advertising of companies within the Network Advertising Initiative by opting out here, or of companies participating in the Digital Advertising Alliance program by opting out here.