Find records of fraud such as those discussed in this column and more in the Food Fraud Database. Image credit: Susanne Kuehne.
In many parts of India, mustard oil is widely consumed as an edible oil and for ceremonial use, and is a target for adulterations for economic gain. In a test of 20 samples, 80% of the samples were adulterated. Adulterants, some of them hazardous to human health, often consist of cheaper oils such as palm or sesame seed oil, as well as added dyes or flavor components. Tests were made using TLC Chromatography, nitric acid test, azo dye test and other test methods.
Find records of fraud such as those discussed in this column and more in the Food Fraud Database. Image credit: Susanne Kuehne.
Honey is a popular item for adulteration, and honey with a specific botanical source is seen as a more valuable product. The Czech Agriculture and Food Inspection Authority took samples of organic Spanish lavender honey in a Czech supermarket, and analyzed the pollen. The analysis showed that the honey was from alternative botanical sources and certainly not lavender.
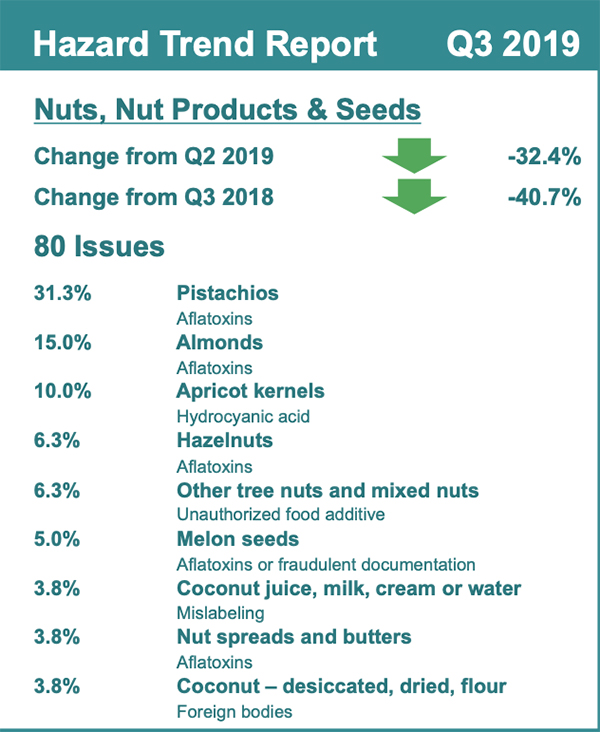
The following infographic is a snapshot of the hazard trends in nuts, nut products and seeds from Q3 2019. The information has been pulled from the HorizonScan quarterly report, which summarizes recent global adulteration trends using data gathered from more than 120 reliable sources worldwide. For the past several weeks, Food Safety Tech has provided readers with hazard trends from various food categories included in this report. This week’s hazard snapshot concludes the series.
Find records of fraud such as those discussed in this column and more in the Food Fraud Database. Image credit: Susanne Kuehne.
The nose knows: In case fish smells “fishy”, it is no longer fit for human consumption. A Canadian fish importing company pleaded guilty to the import of 9,000 pounds of rotten and partially decomposed fish into the United States. The potentially adulterated fish was sampled by the FDA, who declared it to be too spoiled to be sold in the country, hence refused its entry into the United States—but the fish was imported via a wrong shipment declaration anyway. The crime of importing refused food carries a prison sentence of up to a year.
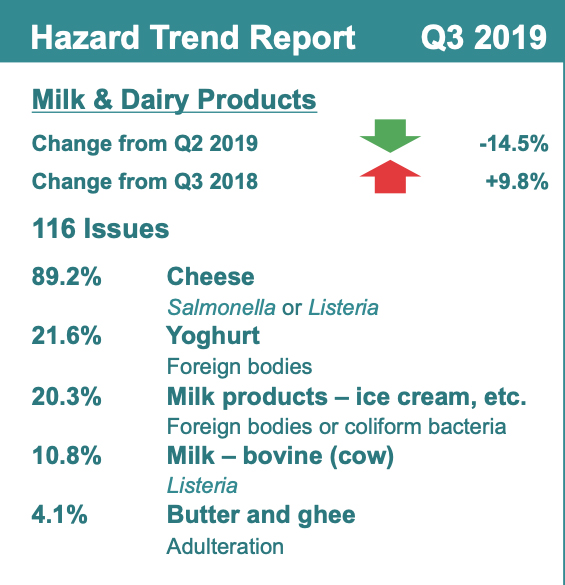
The following infographic is a snapshot of the hazard trends in milk and dairy from Q3 2019. The information has been pulled from the HorizonScan quarterly report, which summarizes recent global adulteration trends using data gathered from more than 120 reliable sources worldwide. For the past several weeks, Food Safety Tech has provided readers with hazard trends from various food categories included in this report. Next week will conclude this series.
Find records of fraud such as those discussed in this column and more in the Food Fraud Database. Image credit: Susanne Kuehne.
In a large study of nearly 6000 products, more than a quarter (27%) of herbal medicines and foods sold in 37 countries on six continents was found to be deliberately or accidentally adulterated. In this study, the products, which came in a variety of forms such as softgels, tea and more, were analyzed with high throughput DNA sequencing and showed mislabeling, added fillers, substituted ingredients or contaminants. Such fraud can be a harmful to consumer health and safety, and must be monitored and tracked closely.
Resource
Ichim, M.C. (October 24, 2019). “The DNA-Based Authentication of Commercial Herbal Products Reveals Their Globally Widespread Adulteration”. “Stejarul” Research Centre for Biological Sciences, National Institute of Research and Development for Biological Sciences, Piatra Neamt, Romania. Frontiers in Pharmacology. Retrieved from https://www.frontiersin.org/articles/10.3389/fphar.2019.01227/full.
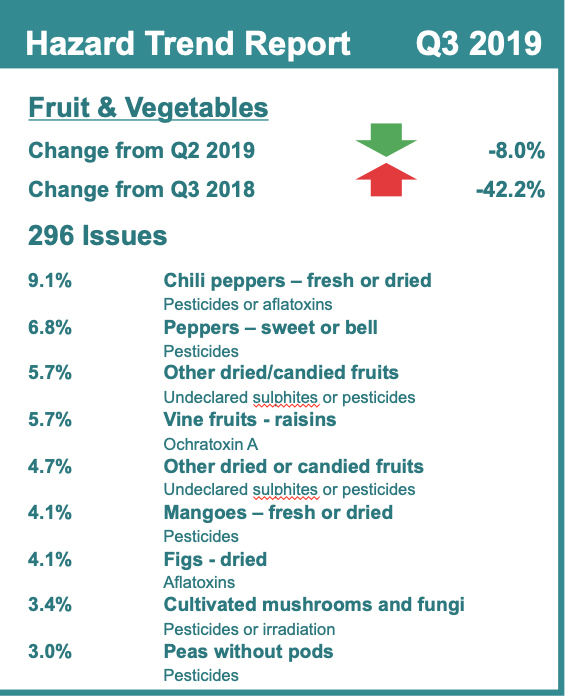
The following infographic is a snapshot of the hazard trends in fruits and vegetables from Q3 2019. The information has been pulled from the HorizonScan quarterly report, which summarizes recent global adulteration trends using data gathered from more than 120 reliable sources worldwide. Over the past and next few weeks, Food Safety Tech will provide readers with hazard trends from various food categories included in this report.
Producers of food-based products are faced with challenges of maintaining the safety and quality of their products, while also managing rapid screening of raw materials and ingredients. Failure to adequately address both challenges can be costly, with estimated recall costs alone starting around $10 million, in addition to any litigation costs.1 Long-term costs can accumulate further as a result of damage to brand reputation. A vast array of methods has been employed to meet these challenges, and adoption continues to increase as technology becomes smaller, cheaper and more user friendly. One such technique is Fourier transform infrared (FTIR) spectroscopy, an analytical technique that is widely used for quick (typically 20–60 seconds per measurement) and non-destructive testing of both man-made and natural materials in food products. The uniformity and physical state of the sample (solid vs. liquid) will dictate the specifics of the hardware used to perform such analyses, and the algorithm applied to the identification task will depend, in part, on the expected variability of the ingredient.
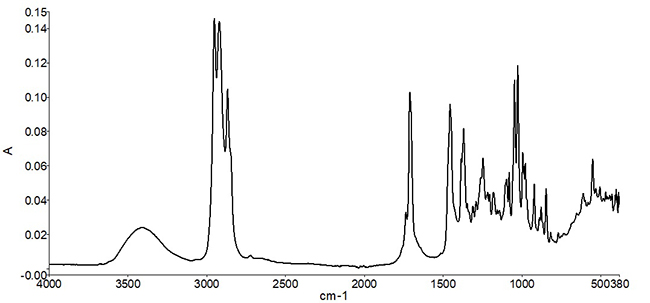
Infrared spectral measurements provide a “compositional snapshot”— capturing information related to the chemical bonds present in the material. Figure 1 shows an example of a mid-infrared spectrum of peppermint oil. Typically, the position of a peak along the x-axis (wavenumber) is indicative of the type of chemical bond, while the peak height is related either to the identity of the material, or to the concentration of the material in a mixture. In the case of peppermint oil, a complex set of spectral peaks is observed due to multiple individual naturally occurring molecular species in the oil.
Figure 1. Mid-infrared spectrum of peppermint oil. The spectrum represents a “chemical snapshot” of the oil, as different peaks are produced as a result of different chemical bonds in the oil.
Once the infrared spectrum of an ingredient is measured, it is then compared to a reference set of known good ingredients. It is important that the reference spectrum or spectra are measured with ingredients or materials that are known to be good (or pure)—otherwise the measurements will only represent lot-to-lot variation. The comparative analysis can assist lab personnel in gaining valuable information—such as whether the correct ingredient was received, whether the ingredient was adulterated or replaced for dishonest gain, or whether the product is of acceptable quality for use. The use of comparative algorithms for ingredient identification also decreases subjectivity by reducing the need for visual inspection and interpretation of the measured spectrum.
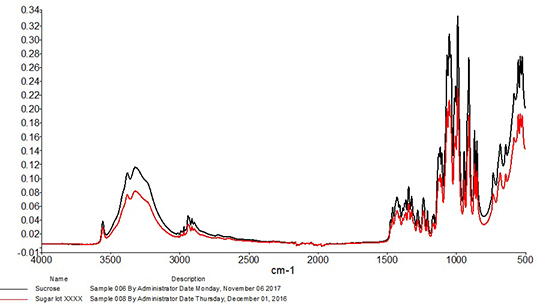
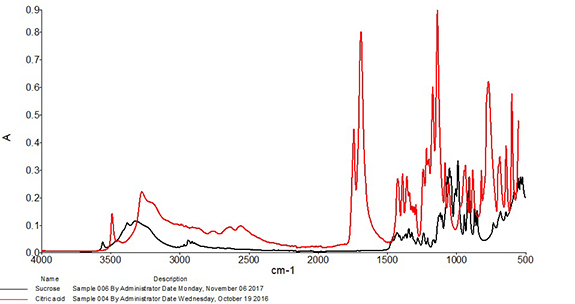
Correlation is perhaps the most widely used algorithm for material identification with infrared spectroscopy and has been utilized with infrared spectra for identification purposes at least as early as the 1970s.2 When using this approach, the correlation coefficient is calculated between the spectrum of the test sample and each spectrum of the known good set. Calculated values will range from 0, which represents absolutely no match (wrong or unexpected material), to 1, representing a perfect match. These values are typically sorted from highest to lowest, and the material is accepted or rejected based on whether the calculated correlation lies above or below an identified threshold. Due to the one-to-one nature of this comparison, it is best suited to identification of materials that have little or no expected variability. For example, Figure 2 shows an overlay of a mid-infrared spectrum of an ingredient compared to a spectrum of sucrose. The correlation calculated between the two spectra is 0.998, so the incoming ingredient is determined to be sucrose. Figure 3 shows an overlay of the same mid-infrared spectrum of sucrose with a spectrum of citric acid. Notable differences are observed between the two spectra, and a significant change in the correlation is observed, with a coefficient of 0.040 calculated between the two spectra. The citric acid sample would not pass as sucrose with the measurement and algorithm settings used in this example.
Figure 2. An overlay of the mid-infrared spectrum of sucrose and a spectrum of a different sample of sucrose.Figure 3: An overlay of the mid-infrared spectrum of sucrose and a spectrum of citric acid.
When testing samples with modest or high natural variability, acceptable materials can produce a wider range of infrared spectral features, which result in a correspondingly broad range of calculated correlation values. The spread in correlation values could be of concern as it may lead to modification of algorithm parameters or procedures to “work around” this variation. Resulting compromises can increase the potential for false positives, meaning the incorrect ingredient or adulterated material might be judged as passing. Multivariate algorithms provide a robust means for evaluating ingredient identity for samples with high natural variability.
Find records of fraud such as those discussed in this column and more in the Food Fraud Database. Image credit: Susanne Kuehne.
Pet food is a highly profitable business. Global pet food sales hit a record $90 billion in 2018, and adulterated or mislabeled feed is not uncommon. In the United States, the FDA ensures correct labeling and adherence to quality standards in pet food. Over the course of six years, a processing facility in Texas shipped low quality, mislabeled ingredients such as feathers and by-products, labeled as premium single ingredients, to pet food manufacturers and distributors. The guilty party had to pay $4.5 millions in restitution to the fraud victims, and the defendant is on a five year probation.
This website uses cookies so that we can provide you with the best user experience possible. Cookie information is stored in your browser and performs functions such as recognising you when you return to our website and helping our team to understand which sections of the website you find most interesting and useful.
Strictly Necessary Cookies
Strictly Necessary Cookies should be enabled at all times so that we can save your preferences for these cookie settings.
We use tracking pixels that set your arrival time at our website, this is used as part of our anti-spam and security measures. Disabling this tracking pixel would disable some of our security measures, and is therefore considered necessary for the safe operation of the website. This tracking pixel is cleared from your system when you delete files in your history.
We also use cookies to store your preferences regarding the setting of 3rd Party Cookies.
If you visit and/or use the FST Training Calendar, cookies are used to store your search terms, and keep track of which records you have seen already. Without these cookies, the Training Calendar would not work.
If you disable this cookie, we will not be able to save your preferences. This means that every time you visit this website you will need to enable or disable cookies again.
Cookie Policy
A browser cookie is a small piece of data that is stored on your device to help websites and mobile apps remember things about you. Other technologies, including Web storage and identifiers associated with your device, may be used for similar purposes. In this policy, we say “cookies” to discuss all of these technologies.
Our Privacy Policy explains how we collect and use information from and about you when you use This website and certain other Innovative Publishing Co LLC services. This policy explains more about how we use cookies and your related choices.
How We Use Cookies
Data generated from cookies and other behavioral tracking technology is not made available to any outside parties, and is only used in the aggregate to make editorial decisions for the websites. Most browsers are initially set up to accept cookies, but you can reset your browser to refuse all cookies or to indicate when a cookie is being sent by visiting this Cookies Policy page. If your cookies are disabled in the browser, neither the tracking cookie nor the preference cookie is set, and you are in effect opted-out.
In other cases, our advertisers request to use third-party tracking to verify our ad delivery, or to remarket their products and/or services to you on other websites. You may opt-out of these tracking pixels by adjusting the Do Not Track settings in your browser, or by visiting the Network Advertising Initiative Opt Out page.
You have control over whether, how, and when cookies and other tracking technologies are installed on your devices. Although each browser is different, most browsers enable their users to access and edit their cookie preferences in their browser settings. The rejection or disabling of some cookies may impact certain features of the site or to cause some of the website’s services not to function properly.
Individuals may opt-out of 3rd Party Cookies used on IPC websites by adjusting your cookie preferences through this Cookie Preferences tool, or by setting web browser settings to refuse cookies and similar tracking mechanisms. Please note that web browsers operate using different identifiers. As such, you must adjust your settings in each web browser and for each computer or device on which you would like to opt-out on. Further, if you simply delete your cookies, you will need to remove cookies from your device after every visit to the websites. You may download a browser plugin that will help you maintain your opt-out choices by visiting www.aboutads.info/pmc. You may block cookies entirely by disabling cookie use in your browser or by setting your browser to ask for your permission before setting a cookie. Blocking cookies entirely may cause some websites to work incorrectly or less effectively.
The use of online tracking mechanisms by third parties is subject to those third parties’ own privacy policies, and not this Policy. If you prefer to prevent third parties from setting and accessing cookies on your computer, you may set your browser to block all cookies. Additionally, you may remove yourself from the targeted advertising of companies within the Network Advertising Initiative by opting out here, or of companies participating in the Digital Advertising Alliance program by opting out here.