

The spread and impact of the COVID-19 pandemic has been fast and furious across the globe.1 The toll on human life and the economy is being felt by everyone, everywhere. Closures of schools and restaurants, restrictions on social gatherings, the shift to working from home, and other social distancing practices have created sudden, unusually high demand spikes across a number of categories, particularly related to food.
COVID-19 in the Food Industry: Mitigating and Preparing for Supply Chain Disruptions | Attend this complimentary webinar on-demandRepercussions from these dramatic demand surges are being felt across entire supply chains. Growers, producers, processors, manufacturers, wholesalers, and retailers of all sizes are scrambling to fill immediate shortages.2,3 At the same time, foodservice operators are reassessing their needs in response to government mandated take-out/delivery-only service. Schools are consolidating preparation and pick-up points for breakfast and lunch programs, while on-campus foodservice venues have closed at colleges and universities. Food companies are scrambling to redeploy and redirect existing inventories, as well as forecast short and mid-term demand and production requirements in the face of an unprecedented situation.
In the first several days of disruption, the immediate response is all-hands-on-deck damage control. Rightfully so. But in the flurry of activity, it is critical that those responsible for demand forecasting document the disruption as it is happening. Why? Because sales history is the foundational input of sales forecasting algorithms. Outlier events, such as COVID-19, natural disasters, extreme weather, short-term international trade restrictions, etc., have the potential to distort demand trends if they aren’t recognized and weighted appropriately in forward-looking projections. Formally documenting extraordinary events allows organizations to:
- Explain unusual variances to history and/or forecast
- Create evergreen institutional knowledge (vs. relying on individuals, scattered notes, and memory)
- Build a “disruption database” that can be used to make fact-based overrides to algorithm-generated statistical forecasts when a similar disruption is predicted or occurs in the future.
These “disruption databases” could ultimately serve as the foundation for even more sophisticated disruption forecasting models. As machine learning and artificial intelligence continue to evolve, these models could potentially be customized based on the type of event. Importantly, this annotation of events needs to occur within your forecasting platform so that it is permanent and visible to inform insights for all forecast users.
So, what information should you capture?
- Timing of the event
- This includes specific days or weeks as well as information across the event lifecycle, including pre, during, and post event completion.
- Geography impacted
- The scale of the event should also be noted. Some events are market-specific (i.e., the 2020 Nashville tornado), while others are state or region-specific (i.e. California wildfires, Hurricane Katrina) or result in national or global level impacts (COVID-19).
- The ship-to locations of your customers relative to the disruption will influence the demand impact of the event.
- Customer gains & losses
- During shortages, changes to current customer strategies should also be accounted for, such as potential volume reallocations. This could mean realignment of current customer distribution centers, temporarily not shipping to or losing specific customers, and/or even securing new customers based on your ability to supply when competitors cannot.
- Customers may also shut down temporarily and/or delay previously scheduled new store openings. They may also reduce their hours of service and/or increase frequency of deliveries.4
- Channel shifts
- The use of different channels in response to the event should also be captured. For example, in response to COVID-19, grocery retailers are seeing a significant increase in home delivery and click-and-collect orders.
- Collaborate with your customers to quantify this shift. It may explain your volume trends (if your products are or aren’t typically purchased online) and/or suggest alternative product forms, packaging, etc. to meet both immediate needs and longer-term demand.
- Products impacted
- This includes both items with demand spikes as well as those realizing unexpected demand declines. Shifts may also occur between product forms. For example, some consumer concern about bulk produce has been expressed with COVID-19 since the produce is manually stocked and shopped.5 While efforts are underway to dispel this misconception, it has impacted short-term demand for both the bulk items and their pre-packed counterparts.6,7
- Adjacent, complementary and/or substitutable items should also be considered.8 Focusing short-term production on core varieties, cuts, forms, etc. vs. a complete assortment may allow a faster return to category (if not item-specific) in-stock levels.
- Ordered vs. filled quantities
- Typically, sales reporting systems only capture what was shipped/invoiced, not what was ordered. Capturing and comparing both enables quantification of the demand “opportunity loss,” which could be factored into future “event” forecast models.
- Consumer sentiment and behavioral shifts
- Specific to COVID-19, Nielsen IRI and Crisp DemandWatch have identified “phases” of consumer behavior and anticipated category purchase impacts. Noting when these phases occur in your forecasting system can provide insight into performance analysis and inform future projections. These consumer patterns may also have application to other extreme events, such as natural disasters.9,10
- In the face of significant disruptions, look for, leverage, and annotate relevant consumer insights to inform the forecast. Link the annotation to a central archive of relevant research and data to expand access and understanding across your organization.
- Raw material, ingredient, packaging, labor or other sourcing issues
- Note any shortages that impacted your ability to meet demand. Your ability to satisfy demand may be impacted by your own suppliers’ ability to get you the necessary inputs and/or your ability to staff production runs.
- Distribution & logistics issues
- Access to truck, rail, and/or air transportation of products may also be disrupted by the event. Note any logistics constraints to delivering finished goods to customers.
- Competitor activity/disruptions
- New product launches, delivery systems, ownership, facility fires, labor shortages or disputes, weather patterns, and more that impact your competitors can also influence demand for your products, both in the short and long term.
In the heat of the crisis, this level of documentation may sound burdensome. Even if you start with notes on a scratch pad, email chains, and a collection of industry newsletters, set aside one morning or afternoon a week to annotate within your forecasting platform the factors that impacted demand that week. Continue to post notations in the week each specific disruption-driving factor begins and each week thereafter until its impact has dissipated. Keeping up with annotations as you go along will keep things fresher in your mind and can help inform immediate and near-term plans.
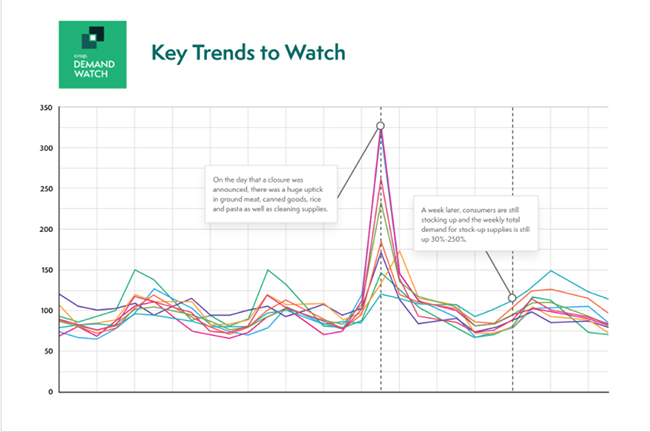
Don’t forget that pantry loading shelf-stable items early in a disruption may significantly impact post-disruption sales, as consumers work through inventory they have at home. Track this as well. Best-in-class forecasting platforms, such as the example shown in Figure 1, can effectively leverage advanced computing power and analytics to help visualize the impact of COVID-19 on supply and follow-on effects predicted to be felt in your markets. The disruption information you track can be gathered, organized, and analyzed along with trillions of data points from disparate sources to generate high-quality statistical demand forecasts and actionable insights with speed and precision.
When the dust settles on this current event, take the time to document other historical disruptions. Working in reverse chronological order, gather as much date-specific archived data and tribal knowledge as you can, and add it to the annotations in your forecasting platform. The next time a disruption occurs (and it will!), you will be equipped to draw on this “database of disruptions” to proactively predict and respond to future impacts on demand.
References
- Coronavirus Disease 2019 (COVID-19). (2020. Centers for Disease Control and Prevention.
- Fares, M, Baertlein, L. (2020). Factories shift operations in scramble to restock supermarket shelves. Yahoo! finance.
- Redman, R. (2020). Coronavirus: How leading grocery chains are responding to keep customers safe and shelves stocked. Supermarket News.
- Wells, Jeff. (2020). Grocers modify store hours to clean and restock amid panic buying. Grocery Drive.
- Naidu, R, Fares, M. (2020). Wary of coronavirus, U.S. shoppers skip the fresh produce aisle. Reuters.
- Ward, A. (2020). COVID 19 Coronavirus Prevention: A dozen things to know about leafy greens. California LGMA.
- Koger, C. (2020). No reason to avoid fresh produce during outbreak. The Packer.
- (2020) Nielsen Investigation: “Pandemic Pantries” pressure supply chain amid COVID-19 fears. Nielsen Insights.
- (2020) Key consumer behavior thresholds identified as the coronavirus outbreak evolves. Nielsen Insights
- (2020) IRI Brief – COVID-19: Impact on CPG and Retail. Retail Wire.