Producers of food-based products are faced with challenges of maintaining the safety and quality of their products, while also managing rapid screening of raw materials and ingredients. Failure to adequately address both challenges can be costly, with estimated recall costs alone starting around $10 million, in addition to any litigation costs.1 Long-term costs can accumulate further as a result of damage to brand reputation. A vast array of methods has been employed to meet these challenges, and adoption continues to increase as technology becomes smaller, cheaper and more user friendly. One such technique is Fourier transform infrared (FTIR) spectroscopy, an analytical technique that is widely used for quick (typically 20–60 seconds per measurement) and non-destructive testing of both man-made and natural materials in food products. The uniformity and physical state of the sample (solid vs. liquid) will dictate the specifics of the hardware used to perform such analyses, and the algorithm applied to the identification task will depend, in part, on the expected variability of the ingredient.
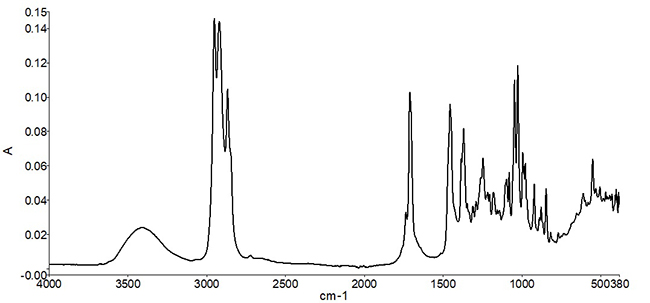
Infrared spectral measurements provide a “compositional snapshot”— capturing information related to the chemical bonds present in the material. Figure 1 shows an example of a mid-infrared spectrum of peppermint oil. Typically, the position of a peak along the x-axis (wavenumber) is indicative of the type of chemical bond, while the peak height is related either to the identity of the material, or to the concentration of the material in a mixture. In the case of peppermint oil, a complex set of spectral peaks is observed due to multiple individual naturally occurring molecular species in the oil.
Figure 1. Mid-infrared spectrum of peppermint oil. The spectrum represents a “chemical snapshot” of the oil, as different peaks are produced as a result of different chemical bonds in the oil.
Once the infrared spectrum of an ingredient is measured, it is then compared to a reference set of known good ingredients. It is important that the reference spectrum or spectra are measured with ingredients or materials that are known to be good (or pure)—otherwise the measurements will only represent lot-to-lot variation. The comparative analysis can assist lab personnel in gaining valuable information—such as whether the correct ingredient was received, whether the ingredient was adulterated or replaced for dishonest gain, or whether the product is of acceptable quality for use. The use of comparative algorithms for ingredient identification also decreases subjectivity by reducing the need for visual inspection and interpretation of the measured spectrum.
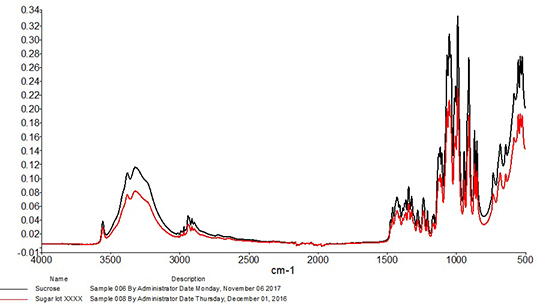
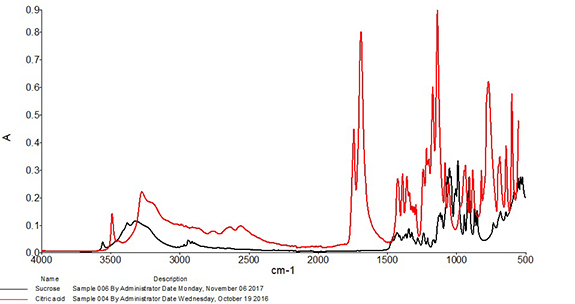
Correlation is perhaps the most widely used algorithm for material identification with infrared spectroscopy and has been utilized with infrared spectra for identification purposes at least as early as the 1970s.2 When using this approach, the correlation coefficient is calculated between the spectrum of the test sample and each spectrum of the known good set. Calculated values will range from 0, which represents absolutely no match (wrong or unexpected material), to 1, representing a perfect match. These values are typically sorted from highest to lowest, and the material is accepted or rejected based on whether the calculated correlation lies above or below an identified threshold. Due to the one-to-one nature of this comparison, it is best suited to identification of materials that have little or no expected variability. For example, Figure 2 shows an overlay of a mid-infrared spectrum of an ingredient compared to a spectrum of sucrose. The correlation calculated between the two spectra is 0.998, so the incoming ingredient is determined to be sucrose. Figure 3 shows an overlay of the same mid-infrared spectrum of sucrose with a spectrum of citric acid. Notable differences are observed between the two spectra, and a significant change in the correlation is observed, with a coefficient of 0.040 calculated between the two spectra. The citric acid sample would not pass as sucrose with the measurement and algorithm settings used in this example.
Figure 2. An overlay of the mid-infrared spectrum of sucrose and a spectrum of a different sample of sucrose.Figure 3: An overlay of the mid-infrared spectrum of sucrose and a spectrum of citric acid.
When testing samples with modest or high natural variability, acceptable materials can produce a wider range of infrared spectral features, which result in a correspondingly broad range of calculated correlation values. The spread in correlation values could be of concern as it may lead to modification of algorithm parameters or procedures to “work around” this variation. Resulting compromises can increase the potential for false positives, meaning the incorrect ingredient or adulterated material might be judged as passing. Multivariate algorithms provide a robust means for evaluating ingredient identity for samples with high natural variability.
Millions of aluminum and tin-plated steel cans enter the marketplace every day, yet despite the extensive efforts of manufacturing plant quality control systems, a small percentage of the cans may have defects that can result in loss of the can integrity and subsequent contamination of the food products. Quality control operations within manufacturing plants typically have limited analytical chemistry capabilities and must rely on the manufacturer’s laboratory or independent laboratories to help identify and characterize the defects and troubleshoot the operations to eliminate the root cause of the defects. This article will present some of the current technology utilized for evaluating metal can defects.
Metal cans made from aluminum for beer and beverage products have been in use for about 50 years, whereas tin-plated steel cans for food products, have been in use for more than 100 years. Throughout that time, many improvements have been made to the design of the cans, the materials used for the cans (metal and internal/external protective organic coatings), the manufacturing equipment, chemical process monitoring, and quality control methods/instrumentation. The can manufacturing plants and their material suppliers are responsible for product integrity prior to distribution of the cans to food and beverage manufacturing operations throughout the world. Incoming quality control and internal quality control are also quite extensive at those manufacturing locations. Many of the can defects that would result in potential consumer issues are quickly eliminated from the consumer pipeline as a result of the rigorous quality control procedures. Occasionally, defective cans find their way into the marketplace, resulting in consumer complaints that must be addressed by the manufacturers.
The cause of the defects must be determined quickly, even if it means shutting down production lines while waiting for answers and corrective actions. Anything that results in a major product recall will have a high priority for the manufacturers to determine the root cause and take corrective actions. Major manufacturers have extensive analytical laboratories with a vast array of instrumentation and technical expertise for troubleshooting the defects. Smaller manufacturers usually have to rely on a network of independent laboratories to assist with their troubleshooting analyses.
Instrumentation and Methodology
Most major can manufacturing plants produce several hundred thousand to several million cans per day, and any can defects detected during quality control inspections will obviously have major implications. Most aluminum and tin-plated steel cans have an organic protective coating applied on the interior surface. One of the major quality control tests is to determine the amount of metal exposure inside the cans. This is done through the use of Enamel Rater instrumentation in which a sampling of cans are filled with an electrolyte. An electrode is immersed into the liquid and external contact is made with the can’s bottom or side wall. When a voltage is applied to the system, the current generated is directly proportional to the amount of exposed metal; a very small amount of exposed metal is acceptable. By reversing the polarity of the system, exposed metal regions produce gas bubbles as a result of the electrochemical reactions. This allows the inspector to identify the location of the exposed metal. When too much metal exposure is encountered, the troubleshooting process begins immediately.
Figure 1. Stereomicroscope image of a crater defect with an iron oxide (rust) particle in the center. (Click to enlarge)
Visual examination of additional cans from the production line is done, followed by examination with a low-power microscope, typically a stereo microscope, in order to characterize metal exposure defects. Typical defects are craters and/or fisheyes, which are seen as circular dewetting (also known as pullback) of the coating from a solid contaminant on the metal (see Figure 1) or an incompatible liquid, such as machine oil mist (fisheye). Additionally, broken blisters in the coating, known as solvent pops, can occur in the curing oven for the coating, resulting in exposed metal. The metal exposure produces two main problems for the filled food product: Metal migration into the product and corrosion of the metal, which eventually results in perforation and product leakage. Manufacturing plants typically do not have the necessary analytical instrumentation available to identify the contaminants and must send selected samples to the laboratory for the analysis.
Another critical test that is conducted in the can manufacturing plants looks for adhesion characteristics of the internal coatings and external coatings (inks and over varnish). A typical adhesion test involves cutting open the sidewalls and immersing the cans into hot water for a period of time. Upon removal from the water, the cans are dried and a tool is used to scribe the coatings. A tape is applied over the scribe marks and rapidly pulled off. If any coating comes up with the tape, the troubleshooting process must begin. Often, over-cure and under-cure conditions can result in coating adhesion failure. The failure can also be caused by a contaminant on the surface of the metal. Loss of internal coating adhesion can result in flakes of the coating contaminating the product and also metal exposure issues. Adhesion failure analysis is typically conducted in the analytical laboratories.
Analytical laboratories are well equipped with a vast array of instrumentation used to identify and characterize various can defects, including:
Optical microscopes, both stereomicroscopes and compound microscopes, are used with a variety of lighting conditions and filters to observe/photograph the defects and in some cases perform microchemical tests to help characterize contaminants. They are also used to examine metal fractures and polished cross sections of metals looking for defects in the metal that may have caused the fractures.
Scanning electron microscope (SEM) equipped with the accessory for energy dispersive X-ray spectrometry (EDS) are used, in conjunction with the optical microscopes, to observe/photograph the defects in the SEM and then obtain the elemental composition of the defect material with the EDS system. This method is typically used for characterizing inorganic materials. Imaging can be done at much higher magnifications compared to the optical microscopes, which is particularly useful for analysis of fractures.
Infrared spectroscopy, commonly referred to as Fourier Transform Infrared (FTIR) spectroscopy, is used mainly to identify organic materials, such as, oils, inks, varnishes, cleaning chemical surfactants that are commonly found in the can manufacturing operations. Solvent extractions from adhesion failure metal surfaces and the mating back side of the coating are often done to look for very thin films of organic contamination.
Differential scanning calorimetry (DSC) instrumentation is often used to determine the degree of cure for protective coatings on cans exhibiting adhesion failure issues.
Other more specialized instrumentation that is more likely available in independent analytical laboratories includes:
X-ray photoelectron spectroscopy (XPS), also known as electron spectroscopy for chemical analysis (ESCA), is used to analyze the outermost molecular layers of materials. The technique is particularly useful for detecting minute quantities of contaminants, typically thin films involved in adhesion failures. Depth profiles can also be done on the metal to determine thickness of oxidation or the presence/absence of surface enhancement chemical treatments. High-resolution binding energy measurements on various elements can provide some chemical compound information as part of the characterization.
Secondary ion mass spectrometry (SIMS) is also an outer molecular layer type of analysis method. Depth profiling also be accomplished with this instrumentation, but one of the major advantages is the ability to detect boron and lithium which are found in some greases and other materials in the manufacturing facility. To help identify organic films that may have resulted in the adhesion failures, it is often crucial to know if boron or lithium is present, which helps identify a potential source.
X-ray diffraction (XRD) instrumentation is used to identify crystalline compounds, mainly inorganic materials but can also be used for certain organic materials. Inorganic materials, isolated from coating craters, are often identified with a combination of SEM/EDS and XRD analyses.
Three case studies are presented to show how analytical lab instruments can be used to identify and characterize metal can defects.Metal can defects can take on numerous forms, some of which have been discussed in this article. Extensive quality control activities in can manufacturing plants often prevent defective cans from entering the marketplace. Characterizing the cause of the defects often requires major troubleshooting activities within the production plants, supplemented by the analytical laboratories with a vast array of instrumentation and personnel expertise. Due to the huge quantities of metal cans produced each day, it is inevitable that some defective cans will make it to the marketplace, resulting in consumer complaints. High priorities must be assigned to consumer complaints to not only identify and characterize the defects, but also to determine how widespread the defective cans are within the marketplace. In this way, decisions can be made regarding product recalls.
This website uses cookies so that we can provide you with the best user experience possible. Cookie information is stored in your browser and performs functions such as recognising you when you return to our website and helping our team to understand which sections of the website you find most interesting and useful.
Strictly Necessary Cookies
Strictly Necessary Cookies should be enabled at all times so that we can save your preferences for these cookie settings.
We use tracking pixels that set your arrival time at our website, this is used as part of our anti-spam and security measures. Disabling this tracking pixel would disable some of our security measures, and is therefore considered necessary for the safe operation of the website. This tracking pixel is cleared from your system when you delete files in your history.
We also use cookies to store your preferences regarding the setting of 3rd Party Cookies.
If you visit and/or use the FST Training Calendar, cookies are used to store your search terms, and keep track of which records you have seen already. Without these cookies, the Training Calendar would not work.
If you disable this cookie, we will not be able to save your preferences. This means that every time you visit this website you will need to enable or disable cookies again.
Cookie Policy
A browser cookie is a small piece of data that is stored on your device to help websites and mobile apps remember things about you. Other technologies, including Web storage and identifiers associated with your device, may be used for similar purposes. In this policy, we say “cookies” to discuss all of these technologies.
Our Privacy Policy explains how we collect and use information from and about you when you use This website and certain other Innovative Publishing Co LLC services. This policy explains more about how we use cookies and your related choices.
How We Use Cookies
Data generated from cookies and other behavioral tracking technology is not made available to any outside parties, and is only used in the aggregate to make editorial decisions for the websites. Most browsers are initially set up to accept cookies, but you can reset your browser to refuse all cookies or to indicate when a cookie is being sent by visiting this Cookies Policy page. If your cookies are disabled in the browser, neither the tracking cookie nor the preference cookie is set, and you are in effect opted-out.
In other cases, our advertisers request to use third-party tracking to verify our ad delivery, or to remarket their products and/or services to you on other websites. You may opt-out of these tracking pixels by adjusting the Do Not Track settings in your browser, or by visiting the Network Advertising Initiative Opt Out page.
You have control over whether, how, and when cookies and other tracking technologies are installed on your devices. Although each browser is different, most browsers enable their users to access and edit their cookie preferences in their browser settings. The rejection or disabling of some cookies may impact certain features of the site or to cause some of the website’s services not to function properly.
Individuals may opt-out of 3rd Party Cookies used on IPC websites by adjusting your cookie preferences through this Cookie Preferences tool, or by setting web browser settings to refuse cookies and similar tracking mechanisms. Please note that web browsers operate using different identifiers. As such, you must adjust your settings in each web browser and for each computer or device on which you would like to opt-out on. Further, if you simply delete your cookies, you will need to remove cookies from your device after every visit to the websites. You may download a browser plugin that will help you maintain your opt-out choices by visiting www.aboutads.info/pmc. You may block cookies entirely by disabling cookie use in your browser or by setting your browser to ask for your permission before setting a cookie. Blocking cookies entirely may cause some websites to work incorrectly or less effectively.
The use of online tracking mechanisms by third parties is subject to those third parties’ own privacy policies, and not this Policy. If you prefer to prevent third parties from setting and accessing cookies on your computer, you may set your browser to block all cookies. Additionally, you may remove yourself from the targeted advertising of companies within the Network Advertising Initiative by opting out here, or of companies participating in the Digital Advertising Alliance program by opting out here.