Find records of fraud such as those discussed in this column and more in the Food Fraud Database, owned and operated by Decernis, a Food Safety Tech advertiser. Image credit: Susanne Kuehne
Adulterated rice wine served at a funeral is suspected to have caused the hospitalization of 76 and the death of eight people in the Pursat Province of Cambodia. The cause of the poisoning is still under investigation by local authorities. Samples of the suspected rice wine and other beverages are being analyzed in a lab. This year, adulterated rice wine was responsible for a multitude of deaths in several Cambodian provinces.
By Benjamin A. Katchman, Ph.D., Michael E. Hogan, Ph.D., Nathan Libbey, Patrick M. Bird No Comments
The Golden Age of Bacteriology: Discovering the Unknown in a Farm-to-Market Food Supply.
The last quarter of the 19th Century was both horrific and exciting. The world had just emerged from four decades of epidemic in cholera, typhoid fever and other enteric diseases for which no cause was known. Thus, the great scientific minds of Europe sought to find understanding. Robert Koch integrated Pasteur’s Germ Theory in 1861 with the high technology of the day: Mathematical optics and the first industrialized compound microscopes (Siebert, Leiss, 1877), heterocycle chemistry, high-purity solvents (i.e., formaldehyde), availability of engineered glass suitable as microscope slides and precision-molded parts such as tubes and plates in 1877, and industrialized agar production from seaweed in Japan in 1860. The enduring fruit of Koch’s technology integration tour de force is well known: Dye staining of bacteria for sub-micron microscopy, the invention of 13 cm x 1 cm culture tubes and the invention of the “Petri” dish coupled to agar-enriched culture media. Those technologies not only launched “The Golden Age of Bacteriology” but also guided the entire field of analytical microbiology for two lifetimes, becoming bedrock of 20th Century food safety regulation (the Federal Food, Drug and Cosmetic Act in 1938) and well into the 21st century with FSMA.
Learn more about technologies in food safety testing at the Food Labs / Cannabis Labs Conference | June 2–4, 2020 | Register now!Blockchain Microbiology: Managing the Known in an International Food Supply Chain.
If Koch were to reappear in 2020 and were presented with a manual of technical microbiology, he would have little difficulty recognizing the current practice of cell fixation, staining and microscopy, or the SOPs associated with fluid phase enrichment culture and agar plate culture on glass dishes (still named after his lab assistant). The point to be made is that the analytical plate culture technology developed by Koch was game changing then, in the “farm-to-market” supply chain in Koch’s hometown of Berlin. But today, plate culture still takes about 24 to 72 hours for broad class indicator identification and 48 to 96 hours for limited species level identification of common pathogens. In 1880, life was slow and that much time was needed to travel by train from Paris to Berlin. In 2020, that is the time needed to ship food to Berlin from any place on earth. While more rapid tests have been developed such as the ATP assay, they lack the speciation and analytical confidence necessary to provide actionable information to food safety professionals.
It can be argued that leading up to 2020, there has been an significant paradigm shift in the understanding of microbiology (genetics, systems based understanding of microbial function), which can now be coupled to new Third Industrial Age technologies, to make the 2020 international food supply chain safer.
We Are Not in 1880 Anymore: The Time has Come to Move Food Safety Testing into the 21st Century.
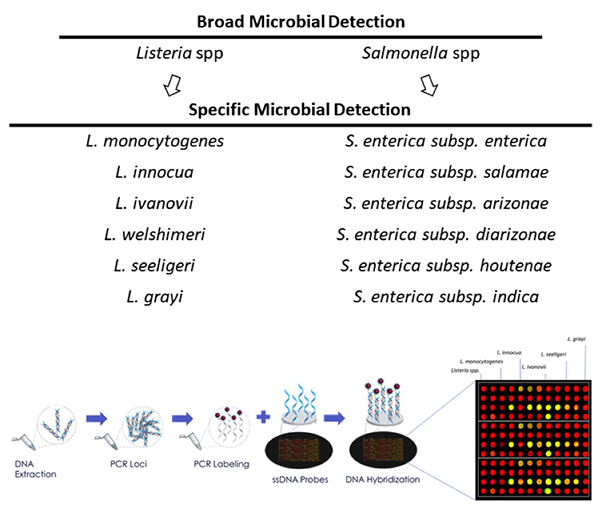
Each year, there are more than 48 million illnesses in the United States due to contaminated food.1 These illnesses place a heavy burden on consumers, food manufacturers, healthcare, and other ancillary parties, resulting in more than $75 billion in cost for the United States alone.2 This figure, while seemingly staggering, may increase in future years as reporting continues to increase. For Salmonella related illnesses alone, an estimated 97% of cases go unreported and Listeria monocytogenes is estimated to cause about 1,600 illnesses each year in the United States with more than 1,500 related hospitalizations and 260 related deaths.1,3 As reporting increases, food producers and regulatory bodies will feel an increased need to surveil all aspects of food production, from soil and air, to final product and packaging. The current standards for pathogenic agriculture and environmental testing, culture-based methods, qPCR and ATP assays are not able to meet the rapid, multiplexed and specificity required to meet the current and future demands of the industry.
At the DNA level, single cell level by PCR, high throughput sequencing, and microarrays provide the ability to identify multiple microbes in less than 24 hours with high levels of sensitivity and specificity (see Figure 1). With unique sample prep methods that obviate enrichment, DNA extraction and purification, these technologies will continue to rapidly reduce total test turnaround times into the single digit hours while simultaneously reducing the costs per test within the economics window of the food safety testing world. There are still growing pains as the industry begins to accept these new molecular approaches to microbiology such as advanced training, novel technology and integrated software analysis.
It is easy to envision that the digital data obtained from DNA-based microbial testing could become the next generation gold standard as a “system parameter” to the food supply chain. Imagine for instance that at time of shipping of a container, a data vector would be produced (i.e., time stamp out, location out, invoice, Listeria Speciation and/or Serovar discrimination, Salmonella Speciation and/or Serovar discrimination, refer toFigure 1) where the added microbial data would be treated as another important digital attribute of the load. Though it may seem far-fetched, such early prototyping through the CDC and USDA has already begun at sites in the U.S. trucking industry, based on DNA microarray and sequencing based microbial testing.
Given that “Third Industrial Revolution” technology can now be used to make microbial detection fast, digital, internet enabled and culture free, we argue here that molecular testing of the food chain (DNA or protein based) should, as soon as possible, be developed and validated to replace culture based analysis.
Current microbiological diagnostic technology is only able to test for broad species of family identification of different pathogens. New and emerging molecular diagnostic technology offers a highly multiplexed, rapid, sensitive and specific platforms at increasingly affordable prices. Graphic courtesy of PathogenDx.
References.
Scallan, E., Hoekstra, R. M., Angulo, F. J., Tauxe, R. V., Widdowson, M. A., Roy, S. L., … Griffin, P. M. (2011). Foodborne illness acquired in the United States–major pathogens. Emerging infectious diseases, 17(1), 7–15. doi:10.3201/eid1701.p11101
Scharff, Robert. (2012). Economic Burden from Health Losses Due to Foodborne Illness in the United States. Journal of food protection. 75. 123-31. 10.4315/0362-028X.JFP-11-058.
Mead, P. S., Slutsker, L., Dietz, V., McCaig, L. F., Bresee, J. S., Shapiro, C., … Tauxe, R. V. (1999). Food-related illness and death in the United States. Emerging infectious diseases, 5(5), 607–625. doi:10.3201/eid0505.990502
Producers of food-based products are faced with challenges of maintaining the safety and quality of their products, while also managing rapid screening of raw materials and ingredients. Failure to adequately address both challenges can be costly, with estimated recall costs alone starting around $10 million, in addition to any litigation costs.1 Long-term costs can accumulate further as a result of damage to brand reputation. A vast array of methods has been employed to meet these challenges, and adoption continues to increase as technology becomes smaller, cheaper and more user friendly. One such technique is Fourier transform infrared (FTIR) spectroscopy, an analytical technique that is widely used for quick (typically 20–60 seconds per measurement) and non-destructive testing of both man-made and natural materials in food products. The uniformity and physical state of the sample (solid vs. liquid) will dictate the specifics of the hardware used to perform such analyses, and the algorithm applied to the identification task will depend, in part, on the expected variability of the ingredient.
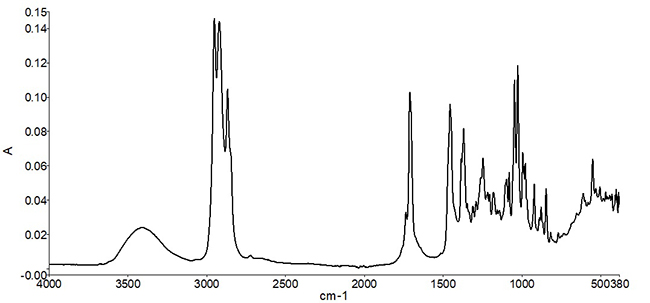
Infrared spectral measurements provide a “compositional snapshot”— capturing information related to the chemical bonds present in the material. Figure 1 shows an example of a mid-infrared spectrum of peppermint oil. Typically, the position of a peak along the x-axis (wavenumber) is indicative of the type of chemical bond, while the peak height is related either to the identity of the material, or to the concentration of the material in a mixture. In the case of peppermint oil, a complex set of spectral peaks is observed due to multiple individual naturally occurring molecular species in the oil.
Figure 1. Mid-infrared spectrum of peppermint oil. The spectrum represents a “chemical snapshot” of the oil, as different peaks are produced as a result of different chemical bonds in the oil.
Once the infrared spectrum of an ingredient is measured, it is then compared to a reference set of known good ingredients. It is important that the reference spectrum or spectra are measured with ingredients or materials that are known to be good (or pure)—otherwise the measurements will only represent lot-to-lot variation. The comparative analysis can assist lab personnel in gaining valuable information—such as whether the correct ingredient was received, whether the ingredient was adulterated or replaced for dishonest gain, or whether the product is of acceptable quality for use. The use of comparative algorithms for ingredient identification also decreases subjectivity by reducing the need for visual inspection and interpretation of the measured spectrum.
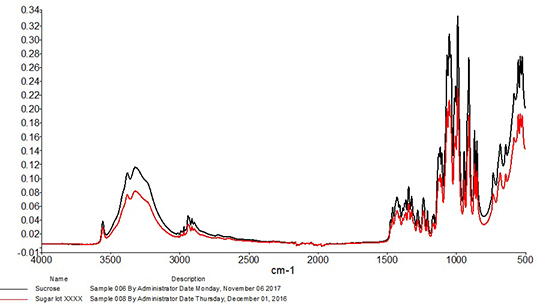
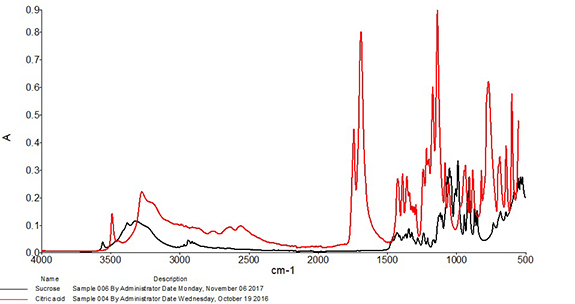
Correlation is perhaps the most widely used algorithm for material identification with infrared spectroscopy and has been utilized with infrared spectra for identification purposes at least as early as the 1970s.2 When using this approach, the correlation coefficient is calculated between the spectrum of the test sample and each spectrum of the known good set. Calculated values will range from 0, which represents absolutely no match (wrong or unexpected material), to 1, representing a perfect match. These values are typically sorted from highest to lowest, and the material is accepted or rejected based on whether the calculated correlation lies above or below an identified threshold. Due to the one-to-one nature of this comparison, it is best suited to identification of materials that have little or no expected variability. For example, Figure 2 shows an overlay of a mid-infrared spectrum of an ingredient compared to a spectrum of sucrose. The correlation calculated between the two spectra is 0.998, so the incoming ingredient is determined to be sucrose. Figure 3 shows an overlay of the same mid-infrared spectrum of sucrose with a spectrum of citric acid. Notable differences are observed between the two spectra, and a significant change in the correlation is observed, with a coefficient of 0.040 calculated between the two spectra. The citric acid sample would not pass as sucrose with the measurement and algorithm settings used in this example.
Figure 2. An overlay of the mid-infrared spectrum of sucrose and a spectrum of a different sample of sucrose.Figure 3: An overlay of the mid-infrared spectrum of sucrose and a spectrum of citric acid.
When testing samples with modest or high natural variability, acceptable materials can produce a wider range of infrared spectral features, which result in a correspondingly broad range of calculated correlation values. The spread in correlation values could be of concern as it may lead to modification of algorithm parameters or procedures to “work around” this variation. Resulting compromises can increase the potential for false positives, meaning the incorrect ingredient or adulterated material might be judged as passing. Multivariate algorithms provide a robust means for evaluating ingredient identity for samples with high natural variability.
This website uses cookies so that we can provide you with the best user experience possible. Cookie information is stored in your browser and performs functions such as recognising you when you return to our website and helping our team to understand which sections of the website you find most interesting and useful.
Strictly Necessary Cookies
Strictly Necessary Cookies should be enabled at all times so that we can save your preferences for these cookie settings.
We use tracking pixels that set your arrival time at our website, this is used as part of our anti-spam and security measures. Disabling this tracking pixel would disable some of our security measures, and is therefore considered necessary for the safe operation of the website. This tracking pixel is cleared from your system when you delete files in your history.
We also use cookies to store your preferences regarding the setting of 3rd Party Cookies.
If you visit and/or use the FST Training Calendar, cookies are used to store your search terms, and keep track of which records you have seen already. Without these cookies, the Training Calendar would not work.
If you disable this cookie, we will not be able to save your preferences. This means that every time you visit this website you will need to enable or disable cookies again.
Cookie Policy
A browser cookie is a small piece of data that is stored on your device to help websites and mobile apps remember things about you. Other technologies, including Web storage and identifiers associated with your device, may be used for similar purposes. In this policy, we say “cookies” to discuss all of these technologies.
Our Privacy Policy explains how we collect and use information from and about you when you use This website and certain other Innovative Publishing Co LLC services. This policy explains more about how we use cookies and your related choices.
How We Use Cookies
Data generated from cookies and other behavioral tracking technology is not made available to any outside parties, and is only used in the aggregate to make editorial decisions for the websites. Most browsers are initially set up to accept cookies, but you can reset your browser to refuse all cookies or to indicate when a cookie is being sent by visiting this Cookies Policy page. If your cookies are disabled in the browser, neither the tracking cookie nor the preference cookie is set, and you are in effect opted-out.
In other cases, our advertisers request to use third-party tracking to verify our ad delivery, or to remarket their products and/or services to you on other websites. You may opt-out of these tracking pixels by adjusting the Do Not Track settings in your browser, or by visiting the Network Advertising Initiative Opt Out page.
You have control over whether, how, and when cookies and other tracking technologies are installed on your devices. Although each browser is different, most browsers enable their users to access and edit their cookie preferences in their browser settings. The rejection or disabling of some cookies may impact certain features of the site or to cause some of the website’s services not to function properly.
Individuals may opt-out of 3rd Party Cookies used on IPC websites by adjusting your cookie preferences through this Cookie Preferences tool, or by setting web browser settings to refuse cookies and similar tracking mechanisms. Please note that web browsers operate using different identifiers. As such, you must adjust your settings in each web browser and for each computer or device on which you would like to opt-out on. Further, if you simply delete your cookies, you will need to remove cookies from your device after every visit to the websites. You may download a browser plugin that will help you maintain your opt-out choices by visiting www.aboutads.info/pmc. You may block cookies entirely by disabling cookie use in your browser or by setting your browser to ask for your permission before setting a cookie. Blocking cookies entirely may cause some websites to work incorrectly or less effectively.
The use of online tracking mechanisms by third parties is subject to those third parties’ own privacy policies, and not this Policy. If you prefer to prevent third parties from setting and accessing cookies on your computer, you may set your browser to block all cookies. Additionally, you may remove yourself from the targeted advertising of companies within the Network Advertising Initiative by opting out here, or of companies participating in the Digital Advertising Alliance program by opting out here.