Tag Archives: microanalysis

Particles on filter

Microanalytical Methods Identify Foreign Materials for FSMA Compliance

By Debra L. Joslin, Ph.D
No Comments
Particles on filter

Implementation of FSMA will result in greater scrutiny of foreign material in food products at every stage of production, as well an entirely new pressure to locate and eliminate the source of contamination from the supply and production chain. Identifying foreign materials found in food products is the first step in determining their source, and therefore in determining how to prevent a given foreign material from being introduced into the product. For identification of small particles ranging from 1–1000 µm, microanalytical techniques are essential.

Examining and Isolating Foreign Material

Before the foreign material is prepared for analysis, the material is examined under a stereomicroscope. Ideally, isolation of the foreign particles from the host matrix and preparation of the foreign particles for microanalysis is performed in a cleanroom, which mitigates the introduction of environmental contamination not related to the initial contamination problem.

Particles on filter
Figure 1. Particles filtered from a liquid product.

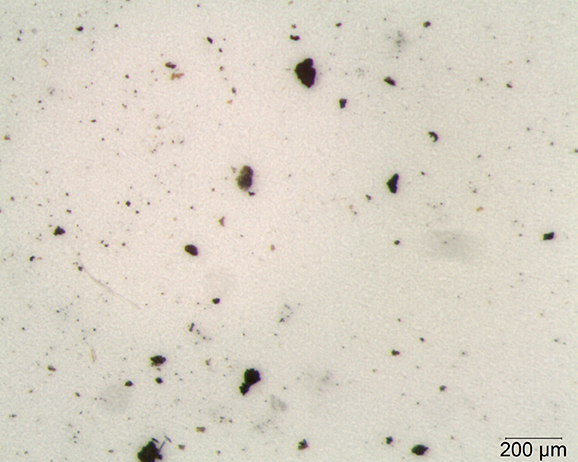
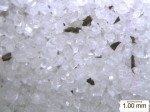
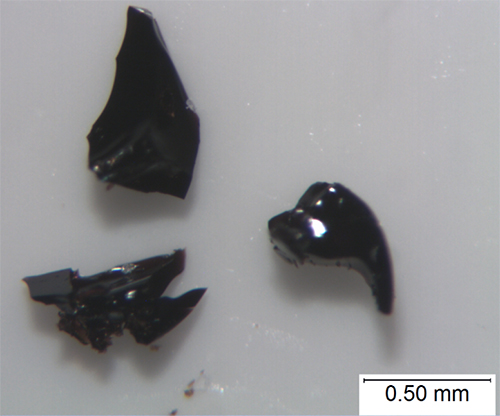
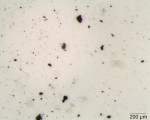
Under the stereoscope, the foreign material is isolated from the product matrix using a tungsten needle probe. It is photographed and the physical characteristics of the material (color, elasticity, magnetic properties, etc.) are observed and documented. Figure 1 shows particles filtered from a liquid product. In this case, the particles are approximately 100 μm and smaller. Most of the particles appear black to dark brown/orange in color. Some are brittle, while others are not. All are magnet responsive.

Only a few particles must be picked and prepared for analysis in this case because the particles are roughly similar. The coloration of the particles, along with their mechanical properties (magnetic, brittle, hard) indicate that the material is likely inorganic; scanning electron microscopy with energy dispersive X-ray microspectrometry (SEM-EDS) could be used to determine the elemental makeup of the material. The coloration and mechanical properties imply the source of the particles could be production machinery.

Figure 2. Corrosion
Figure 2 (click to enlarge)

Identifying Inorganic Compounds with SEM-EDS

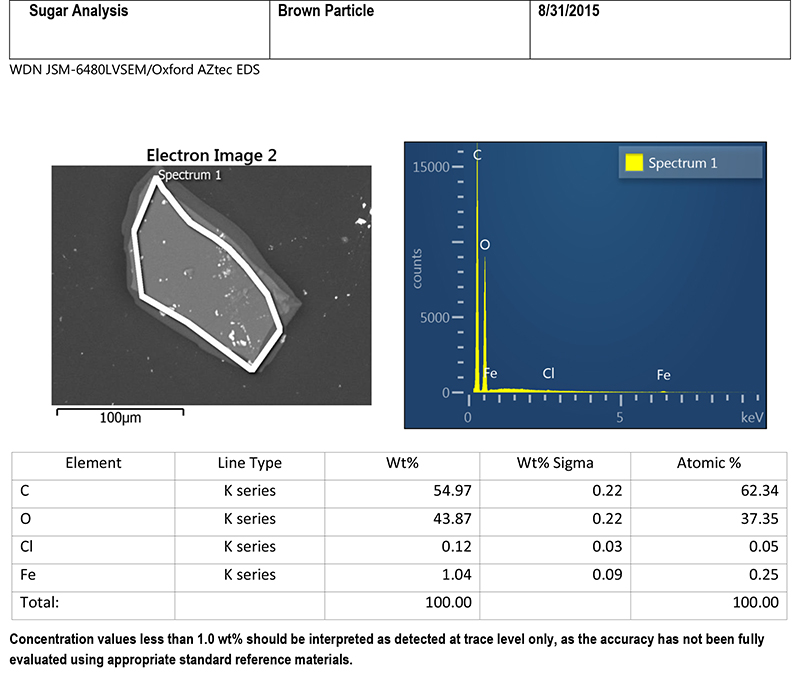
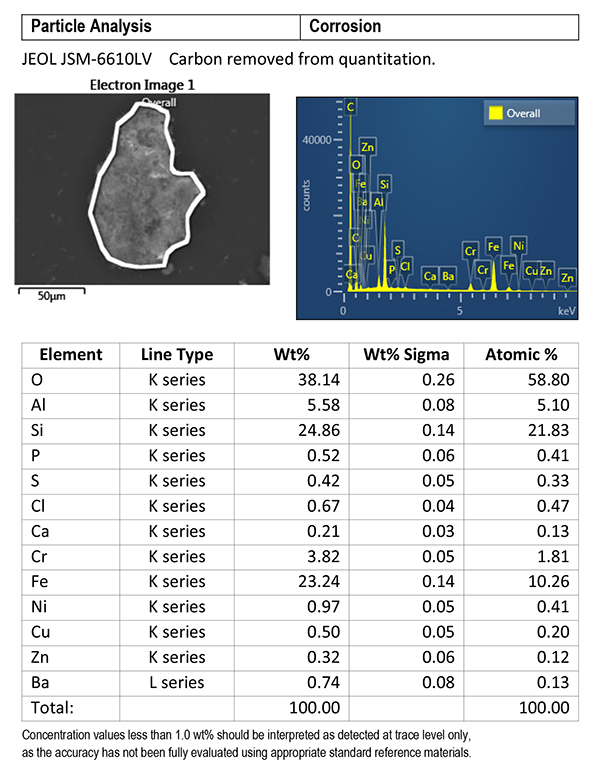
In a scanning electron microscope, a beam of electrons is scanned over the particle producing several signals, some of which are used for imaging, and some that are used for elemental analysis. For this discussion, the signals of interest for elemental analysis are X-rays. The energies of the X-rays are characteristic of the elements found in the sample. By counting these X-rays and arranging them according to their energies, a spectrum is produced, and elements in the sample can be identified and quantified.

Corrosion inclusions
Figure 3 (click to enlarge)

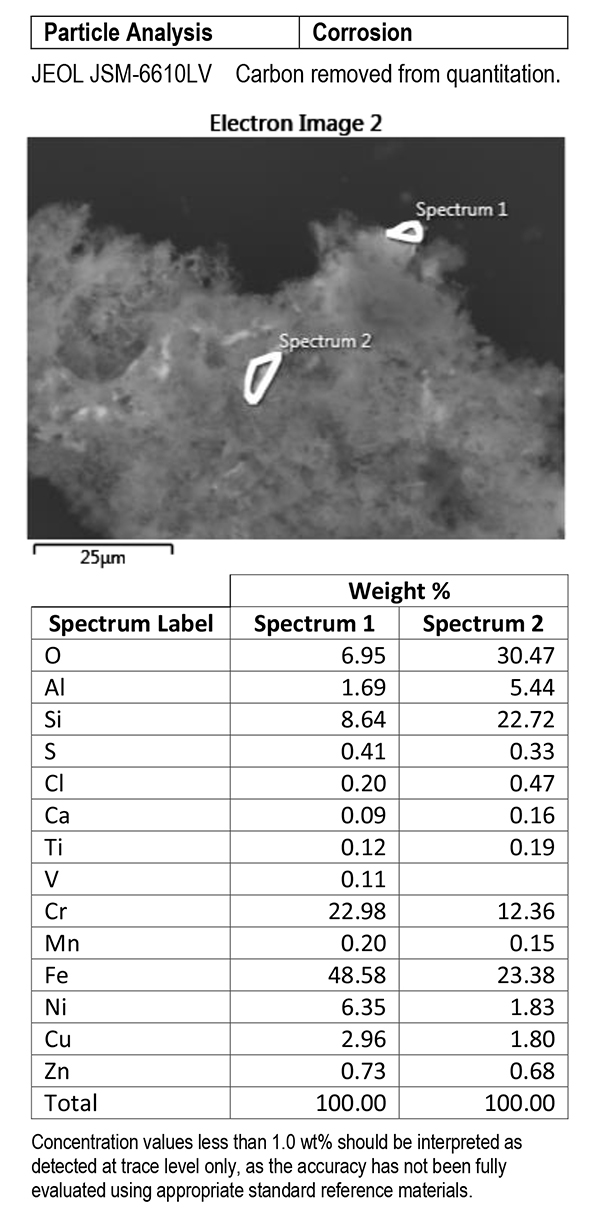
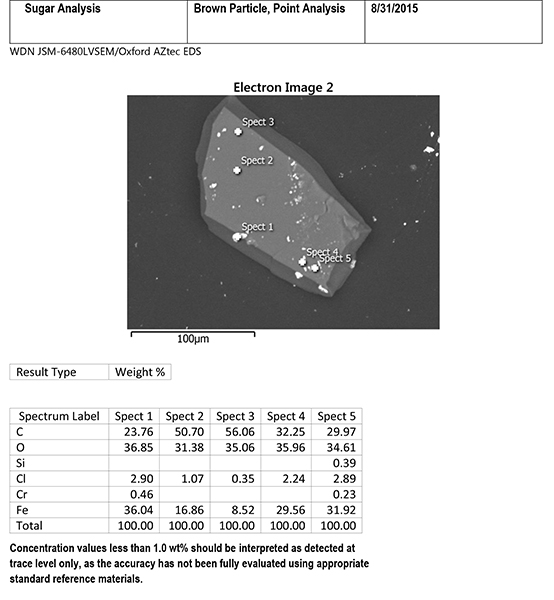
Figures 2 and 3 are SEM-EDS data from one of the brittle particles from the filter. The particle is steel corrosion (iron, chromium, and nickel), possibly with brass corrosion (copper and zinc) and some silicate material (elevated silicon and aluminum). Residues of corrosive agents (chlorine and sulfur) are present. The inclusions analyzed are 300 series stainless steel (see Figure 2). SEM-EDS data from one of the harder dark particles is shown in Figure 4. This particle is oxidized 300 series stainless steel, likely Type 316. 300 series stainless steels are not generally magnetic, but magnetism can be induced during wear processes.

Harder dark particles
Figure 4. SEM-EDS data from harder dark particles. (click to enlarge)

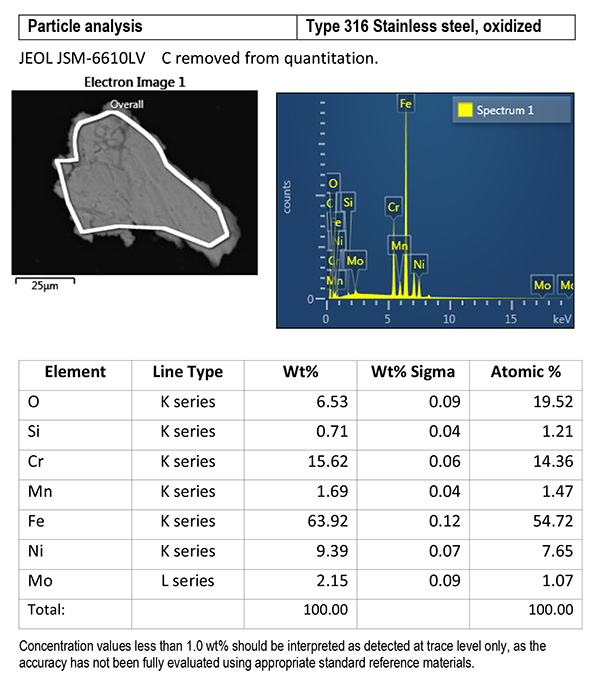
Stainless steels, particularly Type 304 and Type 316 are common in food manufacturing environments. Pinpointing the source of these materials as contaminants can be frustrating due to the number of pieces of equipment made from these alloys. However, other metals are less common, such as Waukesha 88, a bismuth containing nickel-based alloy that is used in pump rotors and other moving parts because of its wear properties. Another less-common alloy is Type 321 stainless steel, a titanium stabilized stainless steel that is used in high temperature equipment where corrosion resistance is needed. Materials such as these are more easily traceable to their source, and therefore more easily repaired and thus eliminated as a source of foreign particles.

Glass particle
Figure 5. Glass particle. (click to enlarge)

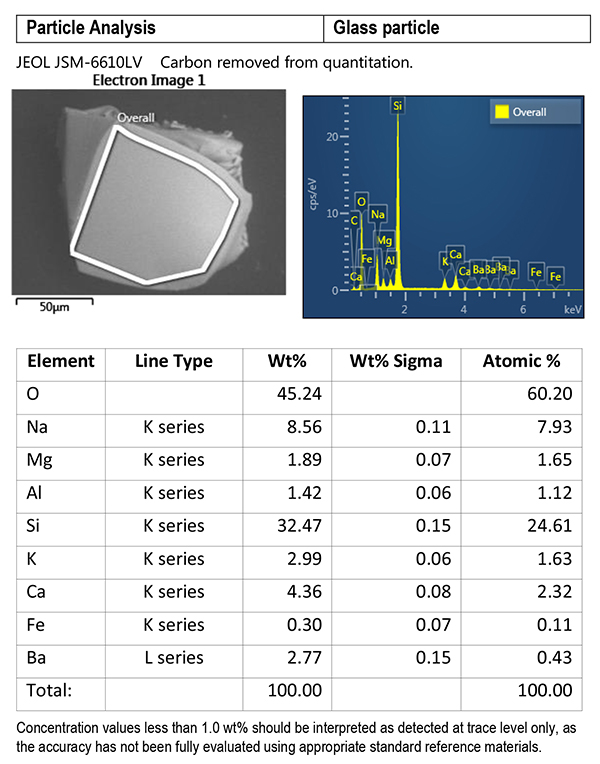
Other inorganic materials, such as glass, are also amenable to identification by SEM/EDS. SEM-EDS data from a glass particle is shown in Figure 5. Often, the glass can be identified as soda-lime glass or borosilicate glass. Soda-lime glass is commonly used for glass containers and bakeware; it is a mixture of oxides, mostly silicon dioxide, sodium oxide, and calcium oxide with smaller amounts of other oxide compounds. Borosilicate glass, commonly used in heat-resistant labware, contains silicon dioxide with a few weight percent boron trioxide, along with other oxide compounds; its composition results in a low coefficient of thermal expansion, and it is used in applications where its chemical and heat resistance are necessary. Identifying the glass type is helpful in determining the source of glass particles.

Identifying Organic Compounds using Fourier Transform Infrared Micro Spectroscopy (Micro-FTIR) Analysis

Reference spectrum for Viton
Figure 6. Reference spectrum for Viton. (click to enlarge)

The SEM-EDS method cannot uniquely identify organic compounds, as it provides only elemental information—an EDS spectrum of organic material shows major carbon, and if it is degraded, oxygen. Protein will contain nitrogen as well.

Cellulose IR spectrum
Figure 7. Cellulose IR spectrum. (click to enlarge)

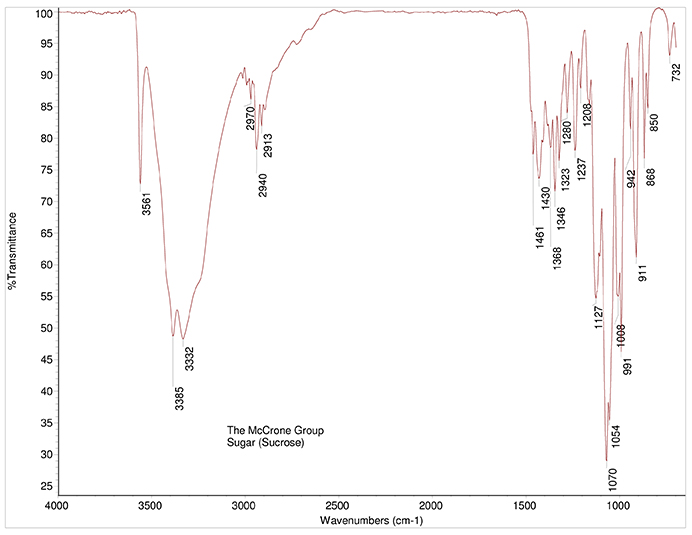
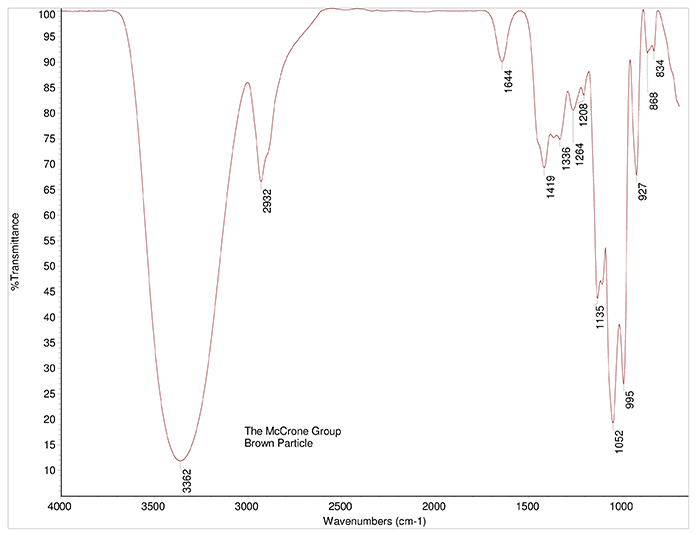
FTIR analysis can identify most organic and a few inorganic materials. For small particles, micro-FTIR (an FTIR system with a microscope coupled to it) is used. Micro-FTIR analysis requires that the sample be thin enough to transmit light, since the system passes a beam of infrared radiation through the sample and records the frequencies at which the sample absorbs infrared radiation. The spectrum from a given material is unique, and even mixtures of materials can often be identified by comparison to known spectra from a reference library using an automated computer search.

Cardboard IR spectrum
Figure 8. Cardboard IR spectrum. (click to enlarge)

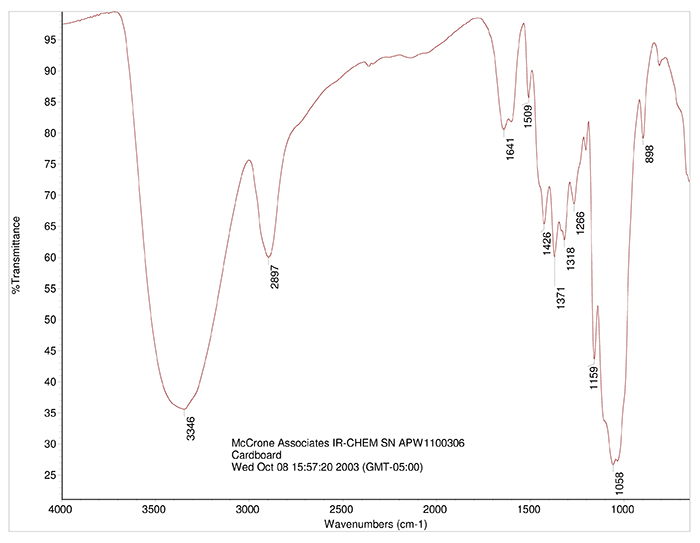
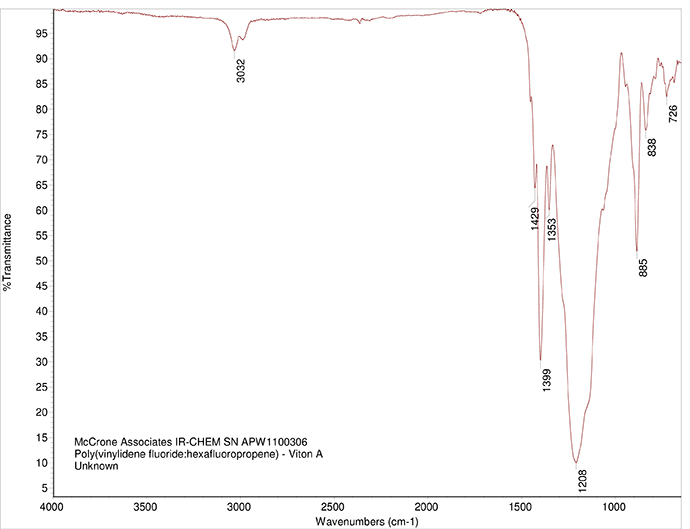
In this way, organic materials such as Viton O-rings can be identified (Figure 6 is a reference spectrum for Viton). Other organic material may be present in the product, such as cellulose (see Figure 7) or cardboard (see Figure 8). While these materials are not dangerous as small particles, they are not desirable in food products. When these kinds of things are found, tracing them to their source may be simple (as in the case of the O-ring material) or hard (cellulose can come from paper or cotton clothing, for example).

If the organic material found has inorganic fillers like titanium dioxide or silicon dioxide, then SEM-EDS can be used in concert with the micro-FTIR to refine the material description and simplify the process of identifying the source of the foreign material.

When used in tandem, SEM-EDS to identify inorganic materials and micro-FTIR to identify organic materials can be powerful tools for determining the origin of foreign particles. These microanalysis methods are essential tools for identifying and tracing the source of contaminant particles in food.

Prevent Contamination from Defects in Metal Can Food Packaging

By Wayne D. Niemeyer
1 Comment

Millions of aluminum and tin-plated steel cans enter the marketplace every day, yet despite the extensive efforts of manufacturing plant quality control systems, a small percentage of the cans may have defects that can result in loss of the can integrity and subsequent contamination of the food products. Quality control operations within manufacturing plants typically have limited analytical chemistry capabilities and must rely on the manufacturer’s laboratory or independent laboratories to help identify and characterize the defects and troubleshoot the operations to eliminate the root cause of the defects. This article will present some of the current technology utilized for evaluating metal can defects.

Metal cans made from aluminum for beer and beverage products have been in use for about 50 years, whereas tin-plated steel cans for food products, have been in use for more than 100 years. Throughout that time, many improvements have been made to the design of the cans, the materials used for the cans (metal and internal/external protective organic coatings), the manufacturing equipment, chemical process monitoring, and quality control methods/instrumentation. The can manufacturing plants and their material suppliers are responsible for product integrity prior to distribution of the cans to food and beverage manufacturing operations throughout the world. Incoming quality control and internal quality control are also quite extensive at those manufacturing locations. Many of the can defects that would result in potential consumer issues are quickly eliminated from the consumer pipeline as a result of the rigorous quality control procedures. Occasionally, defective cans find their way into the marketplace, resulting in consumer complaints that must be addressed by the manufacturers.

The cause of the defects must be determined quickly, even if it means shutting down production lines while waiting for answers and corrective actions. Anything that results in a major product recall will have a high priority for the manufacturers to determine the root cause and take corrective actions. Major manufacturers have extensive analytical laboratories with a vast array of instrumentation and technical expertise for troubleshooting the defects. Smaller manufacturers usually have to rely on a network of independent laboratories to assist with their troubleshooting analyses.

Instrumentation and Methodology

Most major can manufacturing plants produce several hundred thousand to several million cans per day, and any can defects detected during quality control inspections will obviously have major implications. Most aluminum and tin-plated steel cans have an organic protective coating applied on the interior surface. One of the major quality control tests is to determine the amount of metal exposure inside the cans. This is done through the use of Enamel Rater instrumentation in which a sampling of cans are filled with an electrolyte. An electrode is immersed into the liquid and external contact is made with the can’s bottom or side wall. When a voltage is applied to the system, the current generated is directly proportional to the amount of exposed metal; a very small amount of exposed metal is acceptable. By reversing the polarity of the system, exposed metal regions produce gas bubbles as a result of the electrochemical reactions. This allows the inspector to identify the location of the exposed metal.  When too much metal exposure is encountered, the troubleshooting process begins immediately.

Crater defect, stereomicroscope
Figure 1. Stereomicroscope image of a crater defect with an iron oxide (rust) particle in the center. (Click to enlarge)

Visual examination of additional cans from the production line is done, followed by examination with a low-power microscope, typically a stereo microscope, in order to characterize metal exposure defects. Typical defects are craters and/or fisheyes, which are seen as circular dewetting (also known as pullback) of the coating from a solid contaminant on the metal (see Figure 1) or an incompatible liquid, such as machine oil mist (fisheye). Additionally, broken blisters in the coating, known as solvent pops, can occur in the curing oven for the coating, resulting in exposed metal. The metal exposure produces two main problems for the filled food product: Metal migration into the product and corrosion of the metal, which eventually results in perforation and product leakage. Manufacturing plants typically do not have the necessary analytical instrumentation available to identify the contaminants and must send selected samples to the laboratory for the analysis.

Another critical test that is conducted in the can manufacturing plants looks for adhesion characteristics of the internal coatings and external coatings (inks and over varnish). A typical adhesion test involves cutting open the sidewalls and immersing the cans into hot water for a period of time. Upon removal from the water, the cans are dried and a tool is used to scribe the coatings. A tape is applied over the scribe marks and rapidly pulled off. If any coating comes up with the tape, the troubleshooting process must begin. Often, over-cure and under-cure conditions can result in coating adhesion failure. The failure can also be caused by a contaminant on the surface of the metal. Loss of internal coating adhesion can result in flakes of the coating contaminating the product and also metal exposure issues. Adhesion failure analysis is typically conducted in the analytical laboratories.

Analytical laboratories are well equipped with a vast array of instrumentation used to identify and characterize various can defects, including:

  • Optical microscopes, both stereomicroscopes and compound microscopes, are used with a variety of lighting conditions and filters to observe/photograph the defects and in some cases perform microchemical tests to help characterize contaminants. They are also used to examine metal fractures and polished cross sections of metals looking for defects in the metal that may have caused the fractures.
  • Scanning electron microscope (SEM) equipped with the accessory for energy dispersive X-ray spectrometry (EDS) are used, in conjunction with the optical microscopes, to observe/photograph the defects in the SEM and then obtain the elemental composition of the defect material with the EDS system. This method is typically used for characterizing inorganic materials. Imaging can be done at much higher magnifications compared to the optical microscopes, which is particularly useful for analysis of fractures.
  • Infrared spectroscopy, commonly referred to as Fourier Transform Infrared (FTIR) spectroscopy, is used mainly to identify organic materials, such as, oils, inks, varnishes, cleaning chemical surfactants that are commonly found in the can manufacturing operations. Solvent extractions from adhesion failure metal surfaces and the mating back side of the coating are often done to look for very thin films of organic contamination.
  • Differential scanning calorimetry (DSC) instrumentation is often used to determine the degree of cure for protective coatings on cans exhibiting adhesion failure issues.

Other more specialized instrumentation that is more likely available in independent analytical laboratories includes:

  • X-ray photoelectron spectroscopy (XPS), also known as electron spectroscopy for chemical analysis (ESCA), is used to analyze the outermost molecular layers of materials. The technique is particularly useful for detecting minute quantities of contaminants, typically thin films involved in adhesion failures. Depth profiles can also be done on the metal to determine thickness of oxidation or the presence/absence of surface enhancement chemical treatments. High-resolution binding energy measurements on various elements can provide some chemical compound information as part of the characterization.
  • Secondary ion mass spectrometry (SIMS) is also an outer molecular layer type of analysis method. Depth profiling also be accomplished with this instrumentation, but one of the major advantages is the ability to detect boron and lithium which are found in some greases and other materials in the manufacturing facility. To help identify organic films that may have resulted in the adhesion failures, it is often crucial to know if boron or lithium is present, which helps identify a potential source.
  • X-ray diffraction (XRD) instrumentation is used to identify crystalline compounds, mainly inorganic materials but can also be used for certain organic materials. Inorganic materials, isolated from coating craters, are often identified with a combination of SEM/EDS and XRD analyses.

Three case studies are presented to show how analytical lab instruments can be used to identify and characterize metal can defects.Metal can defects can take on numerous forms, some of which have been discussed in this article. Extensive quality control activities in can manufacturing plants often prevent defective cans from entering the marketplace. Characterizing the cause of the defects often requires major troubleshooting activities within the production plants, supplemented by the analytical laboratories with a vast array of instrumentation and personnel expertise. Due to the huge quantities of metal cans produced each day, it is inevitable that some defective cans will make it to the marketplace, resulting in consumer complaints. High priorities must be assigned to consumer complaints to not only identify and characterize the defects, but also to determine how widespread the defective cans are within the marketplace. In this way, decisions can be made regarding product recalls.

Granulated sugar with dark foreign particles

Food Investigations: Microanalytical Methods Find Foreign Matter in Granular Food Products

By Mary Stellmack
No Comments
Granulated sugar with dark foreign particles

The upcoming implementation of FSMA will likely result in increased scrutiny of contaminants in food products. If the foreign matter can be identified, steps can be taken to eliminate the source of contamination and avoid future losses of product. Small foreign particles are sometimes observed in drums of bulk granular or powdered raw materials. While these foreign particles may be seen as dark specks in the product, they are often too small for standard QA/QC methods of analysis. Microanalytical techniques, however, can be used to isolate and identify the specks. This article describes a case study of dark particles in a granulated sugar sample.

Microscope Exam

Ideally, when conducting contaminant analysis, all sample manipulations take place in a cleanroom to eliminate the chance for contamination by extraneous environmental debris. This is especially important when working with small contaminant particles, which may consist of environmental debris such as metal particles, fibers and other types of dirt. If the unknown particles are identified as common environmental debris, the analyst must be certain that he or she did not introduce any debris while handling the unknown sample.

Granulated sugar with dark foreign particles
Figure 1. Granulated sugar with dark foreign particles, 13X (Click to enlarge)

The first step in the identification process involves examination of the sample under a stereomicroscope. Figure 1 is a photomicrograph of dark brown particles, less than 1 mm in size, in the sugar sample. Particles of this size must be isolated from the bulk product prior to analysis in order to correctly identify them.

Since all of the dark particles are visually similar, only a few representative particles need to be isolated. The contaminants can be isolated by removing a small glob of tacky adhesive (50 µm or smaller) from a piece of tape with the pointed tip of a fine tungsten needle. The adhesive-coated needle tip is gently touched to the surface of one of the dark particles, causing the particle to adhere to the needle, and the particle is transferred to a glass slide or other substrate for further examination.

Isolated dark foreign particles
Figure 2. Isolated dark foreign particles, 63X. (Click to enlarge)

Figure 2 is a photomicrograph of three dark particles, isolated from the sugar granulation. The dark brown particles have a smooth, shiny appearance with conchoidal (shell-shaped) fracture surfaces, and are visually consistent with glass. However, when probed with the tungsten needle, the particles are found to be brittle and fragile, and this texture is not consistent with glass. Therefore, chemical analysis is needed to identify the brown particles.

Micro-FTIR Analysis to Identify Organic Components

Most organic compounds (and some inorganic materials) can be identified by Fourier transform infrared (FTIR) spectroscopy. For the analysis of small particles, a microscope is coupled with a standard FTIR system; this method of analysis is known as micro-FTIR analysis. The micro-FTIR system passes a beam of infrared radiation through the sample and records the different frequencies at which the sample absorbs the light, producing a unique infrared spectrum, which is a chemical fingerprint of the material. By comparing the spectrum of the sample with spectra of known compounds from a reference library through an automated computer search, the sample can often be identified.

In order for the FTIR analysis to work, the sample must be transparent, or thin enough to transmit light. In the case of the particles from this case study, this is achieved by applying pressure to a ~50 µm portion of the sample until it forms a thin transparent film. This film is placed on a salt crystal for micro-FTIR analysis.

An FTIR spectrum of crystalline sugar is shown in Figure 3, and a spectrum of a brown particle is shown in Figure 4. The spectrum of the brown particle has some similarities to sugar, but there are fewer peaks, and the remaining peaks are rounded, consistent with a loss of crystallinity. The loss of crystallinity, coupled with the brown color of the particles, suggests charred sugar.

FTIR spectrum of granulated sugar
Figure 3. FTIR spectrum of granulated sugar. (Click to enlarge)

Figure 4. FTIR spectrum of a dark foreign particle, microanalysis
Figure 4. FTIR spectrum of a dark foreign particle. (Click to enlarge)

SEM/EDS to Identify Inorganic Compounds

The FTIR method does not provide complete information about the presence or absence of inorganic materials in the contaminant. To complete the analysis of the brown particles, scanning electron microscopy (SEM) combined with an energy dispersive X-ray spectrometer (EDS) detector is needed. Using the SEM/EDS method, two types of information are obtained: SEM provides images of the sample, and the EDS identifies the elements that are present.

SEM/EDS analysis of a dark foreign particle
Figure 5. SEM/EDS analysis of a dark foreign particle

A brown particle was mounted on a beryllium stub with a small amount of adhesive, and submitted for SEM/EDS analysis. Figure 5 includes an SEM image of the particle, and a table of EDS data. The SEM image provides some information about the composition of the particle. This image was acquired using backscattered electron mode, in which heavier elements appear lighter in color. The image displays light colored specks scattered across the surface of the particle, indicating that more than one type of material is present. The light-colored circle on the SEM image shows the area that was included in the EDS analysis (the entire particle was analyzed). Looking at the column in the table for weight percent (Wt%), the particle consists primarily of carbon and oxygen, with small amounts of chlorine and iron. Carbon and oxygen are chemical constituents of sugar, but chlorine and iron are not.

SEM/EDS analysis of specks on a dark foreign particle
Figure 6. SEM/EDS analysis of specks on a dark foreign particle

The EDS system can also be used to focus on individual small areas on the particle. Figure 6 includes EDS data from five specific light-colored specks on the surface of the brown particle. The specks contain major amounts of iron with small amounts of chlorine, and sometimes chromium and silicon, plus contributions from carbon and oxygen from the surrounding sugar matrix. The composition of the specks indicates steel corrosion, likely from low alloy steel. The presence of chlorine suggests that a chlorinated substance was the initiator for the corrosion process.

In some cases, steel corrosion can be the sole cause of brown or dark discoloration of small particles. In the case of this brown particle, the SEM image shows that the iron-rich particles are not evenly distributed throughout the particle, but are only scattered on the surface. Charring is the most likely cause of the overall brown color of the particle.

Conclusion

When examined under the microscope, the dark particles in the sugar sample had the visual appearance of glass. However, chemical microanalysis of the particles revealed that they were not glass at all, highlighting the importance of microanalytical methods in determining the identity of the foreign matter. The brown particles were ultimately identified as charred sugar particles with scattered specks of steel corrosion (likely from low alloy steel) on the surface. This information can be used to narrow down the search for possible sources of the brown particles in the bulk sugar sample. As part of a root cause investigation, samples of dark particles from various locations in the manufacturing and packaging processes can be studied by the same techniques to look for a match.

More information about FTIR analysis is available in the webinar, Preparation of Polymer Samples for Microspectroscopy