Tag Archives: vision systems

Addressing Foreign Material Contamination in Food Products

By Kurt Westmoreland
No Comments

I’ve seen it all when it comes to foreign material contamination — from electrical wire to welding slag to a folded-up $50 bill in a block of frozen protein. Physical foreign material contamination isn’t isolated to one type of material, phase of the manufacturing process or point in your supply chain. Physical contaminants can enter food product anywhere, anytime, making reliable detection and actionable traceability vital for producers to ensure safe food to market. We typically trace the issue back to one of three “stops” on a food product’s journey to the end consumer.

Stop 1: Raw Materials

Let’s start from square one: raw materials pose a foreign contamination threat, especially in the case of meat/poultry and fruit/vegetable products. If livestock consume inorganic material like stone or plastic, or metal pieces from plant harvest machinery find their way into plant/organic matter, contamination is immediately a concern. If physical contaminants aren’t detected by a raw ingredient supplier, the risks they pose can be passed downstream in the supply chain to other producers.

Stop 2: Processing

Most raw materials go through an initial stage of processing to turn them into usable ingredients for later-stage producers. This processing stage can involve a higher activity level, leading to more machinery interaction. Perhaps bone debris remains in protein after deboning, or a maintenance failure leads to a lost screw in plant matter. The activity levels at this stage in the supply chain call for increased scrutiny of physical contamination detection and prevention.

Stop 3: Production

Last, these processed ingredients are often turned into prepared or packaged foods. These processes typically include a more refined level of machinery involvement, but also include unique foreign material risks. Machinery, packaging and product breakage are all common challenges at this stage. In the past, we’ve found broken jars, missing pens, lost eyeglasses and more. No producer, no product, no process is immune to this threat—particularly when human beings are involved.

The modern food production environment is highly mechanized, and no matter how new and improved technology may be, the risk of foreign material exists from the machinery used to produce at high throughput. Line extensions, wear and tear, new construction and routine maintenance all play a role in introducing the problem of foreign material in the job of feeding our customers.

Counting the Costs of Foreign Material Contamination

There are many downstream impacts of foreign material contamination. Some are quantifiable, some are not—but all of them hold weight in their own right. Missed orders lead to dissatisfied customers. Storage challenges lead to sunk costs at your facility. Downgraded product leads to lost value and smaller profit margins.

While it’s nearly impossible to sum up the potential effects of foreign material contamination, the image below serves as a point of reference for the many considerations producers have related to this issue.

73% of companies we surveyed in 2024 reported a foreign material incident at least quarterly, many of them citing weekly challenges. Last year, 70 recalls occurred due to foreign material contamination. That frequency is noteworthy, but it doesn’t have to be a crisis. Foreign material contamination can be managed and addressed within any food safety program.

Taking a Closer Look: Technology in Food Inspection

If there’s one thing we know about our industry, it’s that technology is always expanding. More than 50% of food producers use X-ray technology in some form, but there are many other inspection options available:

  • Metal Detection. Metal detectors use electric signal disruption to detect metal within a food product. They are of limited use when food contains high moisture, salt, or sugar. They are most effective for aluminum and ferrous metals.
  • Vision Systems. These systems use machine learning to “teach” the system but are more often used for qualitative analysis than for foreign material detection, as their examination is only surface-level. Foreign material can and does appear both on and in product.
  • Hyperspectral. Hyperspectral systems emit photons of various wavelengths and use spectroscopic sensors to evaluate the energy directed back to identify the material type. While this system type only works at the surface level, it is one of the most reliable detection systems for rubbers and plastics.
  • Microwave. While used sparingly in the food and beverage industry, these systems use microwaves and disturbances in the resulting electromagnetic field to detect foreign material. These systems are excellent at detection but haven’t yet reached mass adoption.
  • Computed Tomography (CT). CT systems create a 360-degree rotational view of the product, overcoming the positional constraints of a 2D system. Production speeds are too fast for this to work in-line, but these systems are very effective for use off-line.

Embracing technology allows food producers to tailor their contamination prevention and detection strategies to meet their operations’ unique challenges. No matter how physical contaminants are found, once they’re known, the question becomes: What do we do now?

What To Do With a Product Hold

Producers have options to address foreign material contamination incidents. The instinctive reaction may be product disposal, which eliminates the threat of physical contaminants entirely. The ripple effects are lost revenue, potentially damaged retailer relationships and a negative impact to sustainability goals.

In some cases, internal inspection is the best option. Manufacturers use in-house resources and equipment to re-inspect products for contamination, but this option has its limitations. Food manufacturers’ core competency is just that—manufacturing. Plants are equipped, and employees are trained to produce as much food as profitably possible and not to slowly reinspect food, which increases the cost of labor, downtime and overtime.

Third-Party Inspection: A Secret Weapon

Another option exists: third-party inspection. In the majority of cases, a third-party inspection company can find foreign material contamination and limit product loss to only product that is contaminated. This allows companies to recapture revenue that would otherwise be lost at an extremely competitive ROI. It avoids concerns about hidden internal costs of rework, protects brand reputations, protects relationships, ensures manufacturing efficiency, meets or grows sustainability compliance, and upholds product and supplier quality.

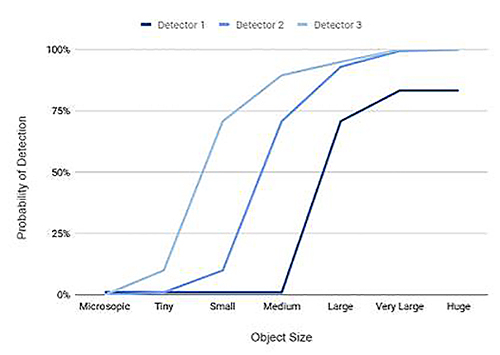
Third-party providers are also typically able to provide data that helps you make the best decisions possible for hold and release—and, in some cases, can provide the data that aids your team in tracking down the issues that are contributing to physical contamination in your supply chain or at your facility. It’s not about scrubbing product clean, it’s about detecting objects at small sizes and providing producers with the opportunity to make better, risk-based decisions.

The two key points of difference between in-house reinspection and third-party inspection are the process and the technology.

Process

  • Line Speed: third-party inspection line speeds average 4-5 feet per minute
  • Multiple Inspectors: third-party inspection services operate multiple, concurrent inspection lines
  • Multiple Facilities: larger third-party inspection services operate multiple facilities across the U.S.
  • Trained Inspectors: third-party inspectors are trained specifically to find foreign material, not produce food

Technology

  • X-Ray Type: typical inline machines use a linear diode x-ray configuration while leading third-party inspectors use flat panel configurations that enable greater contrast and depth
  • X-Ray Size: inline detection technology is typically fixed in place and customized to the product size at a specific stage of production, whereas third-party can inspect product in various sizes and configurations using customized equipment built for that purpose
  • X-Ray Sensitivity: inline detection technology is typically built to detect known foreign material types, while third-party technology is designed to detect foreign material of all types

Here’s the bottom line: foreign material contamination isn’t a possibility, it’s a promise. The good news is, producers aren’t powerless. By taking a careful look at their operations, they can determine what tools and methodology will help safeguard their product and their profits, both short and long term.

Olga Pawluczyk, P&P Optica
FST Soapbox

Assessing Detection Systems to Make Food Safer

By Olga Pawluczyk
No Comments
Olga Pawluczyk, P&P Optica

It is an exciting time to be in the food industry. Consumers are ever more aware of what they are eating and more demanding of quality. And the vital need to reduce global food waste is transforming how we produce and consume food. This is driving innovation all the way along the supply chain, from gate to plate.

One of the biggest areas of opportunity for the industry to increase automation and improve food safety is in the processing plant. The challenges processors have faced in the last 12 months have accelerated the focus on optimizing resources and the drive for more adoption of new technology.

Foreign material contamination is a growing issue in the meat industry and new types of detection systems are emerging to help address this challenge. As Casey Gallimore, director of regulatory and scientific affairs at the North American Meat Institute, highlighted in a recent webinar, 2019 was a record year for the number of recalls related to foreign object contamination, which totaled 27% of all FSIS recalls in that year.

“There are a number of potential reasons why recalls due to foreign object contamination have increased over the years: Greater regulatory focus, more discerning consumers, [and] more automation in plants. But one important reason for this trend is that we have a lot of new technology to help detect more, [but] we are not necessarily using it to its full potential,” said Gallimore. “As an industry, we have a strong track record of working together to provide industry-wide solutions to industry-wide problems. And I believe that education is key to understanding how different detection systems—often used together—can increase the safety and quality of our food.”

Types of Detection Systems

Processors use many different detection systems to find foreign materials in their products. Equipment such as x-rays and metal detectors, which have been used for many years, are not effective against many of today’s contaminants: Plastics, rubber, cardboard and glass. And even the most well trained inspectors are affected by fatigue, distraction, discomfort and many other factors. A multi-hurdle approach is imperative, and new technologies like vision systems need to be considered.

Vision systems, such as cameras, multi-spectral, and hyperspectral imaging systems can find objects, such as low-density plastics, that may have been missed by other detection methods. Yet, depending on the system, their performance and capabilities can vary widely.

Camera-based systems are the most similar to the human eye. These systems are good for distinguishing objects of varying size and shape, albeit in two-dimensions rather than three. But they become less effective in situations with low contrast between the background and the object being detected. Clear plastics are a good example of this.

Multi-spectral systems are able to see more colors, including wavelengths outside of the visible spectrum. However, multispectral systems are set up to use only specific wavelengths, which are selected based on the materials that the system is expected to detect. That means that multispectral systems can identify some chemical as well as visual properties of materials, based on those specific wavelengths. It also means that other materials, which the system has not been designed to find, will likely not be detected by a multispectral system.

Another relatively new type of vision system uses hyperspectral imaging. These systems use chemistry to detect differences in the materials being inspected and therefore recognize a broad range of different contaminants. They are especially good at seeing objects that cameras or human inspectors may miss and at identifying the specific contaminant that’s been detected. The same system can assess quality metrics such as composition and identify product flaws such as woody breast in chicken. Hyperspectral systems also gather tremendous amounts of chemistry data about the products they are monitoring and can use artificial intelligence and machine learning to get a more holistic picture of what is happening in the plant over time, and how to prevent future contamination issues. This might include identifying issues with a specific supplier, training or other process challenges on one line (or in one shift), or machinery in the plant that is causing ongoing contamination problems.

Many processors are considering implementing new inspection systems, and are struggling to understand how to compare the expected performance of different systems. One relatively simple methodology that can be used to evaluate system performance is, despite its simplicity, called a “Confusion Matrix”.

The Confusion Matrix

A confusion matrix is often used in machine learning. It compares the expected outcome of an event with the actual outcome in order to understand the reliability of a test.

Figure 1 shows four possible outcomes for any kind of test.

Actual (True Condition)

Predicted

(Measured Outcome)

Positive (P) Negative (N)
Positive Detection True Positives (TP) False Positives (FP)
Negative Detection False Negatives (FN) True Negatives (TN)
P = TP + FN N = FP + TN
Figure 1. Confusion Matrix

But what does a confusion matrix tell us, and how can it help us assess a detection system?

The matrix shows us that a detection system may incorrectly register a positive or negative detection event—known as a ‘False Positive’ or ‘False Negative’.

As an example, say we are testing for a disease such as COVID-19. We want to know how often our system will give us a True Positive (detecting COVID when it *IS* present) versus a False Positive (detecting COVID when it *IS NOT* present).

Let’s apply this to processing. If you are using an x-ray to detect foreign objects, a small piece of plastic or wood would pass through unnoticed. This is a False Negative. By contrast, a system that uses hyperspectral imaging would easily identify that same piece of plastic or wood, because it has a different chemical signature from the product you’re processing. This is a True Positive.

A high rate of false negatives—failing to identify existing foreign materials—can mean contaminated product ends up in the hands of consumers.

The other side of the coin is false positives, meaning that the detector believes foreign material to be present when in fact it is not. A high rate of False Positives can lead to significant and unnecessary product wastage, or in time lost investigating an incident that didn’t actually occur (see Figure 2).

True Positives and False Positives
Figure 2. Balance of True Positives and False Positives

The secret to a good detection system lies in carefully balancing the rates of true positives and false positives by adjusting the sensitivity of a system.

This is where testing comes in. By adjusting a system and testing under different conditions, and then plotting these outcomes on the confusion matrix, you get an accurate picture of the system’s performance.

Effectiveness of a Detector

Detection is not just the act of seeing. It is the act of making a decision based on what you have seen, by understanding whether something of importance has occurred. Many factors influence the effectiveness of any detection system.

Resolution. This is the smallest size of object that can possibly be detected. For example, when you look at a photograph, the resolution affects how closely you can zoom in on an image before it becomes blurry.

Signal to noise ratio. This measures the electronic “noise” of the detector and compares it with the “background noise” that may interfere with the signals received by the detector. Too much background noise makes it harder to identify a foreign object.

Speed of acquisition. This measures how fast the detector can process the signals it receives. Motion limits what you can see. As line speeds increase, this impacts what detectors are able to pick up.

Material being detected. The type of material being detected and its properties will have a significant impact on the likelihood of detection. As previously mentioned, for example, x-rays are unlikely to detect low-density materials such as cardboard, resulting in a high number of False Negatives.

Presentation or location of material being detected. Materials that are underneath another object, that are presented on an angle, are too similar to the product being inspected, or are partially obstructed may be more difficult for some detectors to find. This also presents a risk of False Negatives.

Complexity of the product under inspection. Product composition and appearance vary. For example, just like the human eye, finding a small object on a uniformly illuminated and uniform color background like a white kitchen floor is much easier than finding the same small object on a complex background like industrial carpet. Coarsely ground meat might be more difficult to detect than uniform back fat layers, for example.

Environment. Conditions such as temperature and humidity will have a significant effect on detection.

Detection Curves

To understand system performance even better, we can use a detection curve. This plots out the likelihood of detection against different variables (e.g., object size) and allows us to objectively compare how these different factors impact the performance of each system.

Figure 3 shows how this looks when plotted as a curve, with object size on the x-axis (horizontal) and the probability of detection (a True Positive from the Confusion Matrix) on the y-axis (vertical). It shows three examples of possible detection curves, depending on the detector being used.

Detection curves
Figure 3. Examples of detection curves for different detectors. Probability of detection of an object increases as the size of the object increases.

A detection curve tells you both the smallest and largest object that a detector will find and the probability that it will be found.

In the example presented by Figure 3, Detector 3 can see essentially 100% of large and very large objects, as can Detector 2. But Detector 3 is also more likely than the other two systems in the example to see microscopic objects. Based on this detection curve it would likely be the best option if the goal were to detect as many foreign objects as possible, of all sizes.

Of course, the performance of a detector is determined by multiple measures, not just size,

Detection capability can be improved for most detection systems, but typically comes at a significant cost: Increasing sensitivity will increase the number of false positives, resulting in increased product rejection. This is why looking at the detection curve together with the false-positive/false-negative rates for any detection system gives us a clear picture of its performance and is invaluable for food processing plants when selecting a system.

Using the confusion matrix and a detection curve, processors can compare different detection systems on an apples-to-apples basis. They can easily see whether a system can identify small, tiny or microscopic objects and, crucially, how often it will identify them.

Every detection method—X -ray, metal detection, vision systems, manual inspection—presents a trade-off between actual (correct) detection, rejection of good product (false positive) and missed detections (false negative). This simple way to compare differences means processors can make the right decision for the specific needs of their plant, based on easily gathered information. For all of us data geeks out there, that sounds like the Holy Grail.