Find records of fraud such as those discussed in this column and more in the Food Fraud Database. Image credit: Susanne Kuehne
Honey is an easy target for food fraud and adulteration with sucrose, high fructose corn syrup, molasses and other sugars are not uncommon. To quickly identify adulterants, a method using Raman spectroscopy and pattern recognition analysis was developed. To verify the method, 97 samples were tested with the new method, and the tests confirmed with HPLC, with the result that 17% of the commercial honey samples showed fraud from added sugars.
Raman spectroscopy (RS) can be used to identify layers in polymer food packaging films to better understand the laminated plastic’s chemical composition. A Raman spectrum is obtained by illuminating a sample with a laser and collecting and measuring scattered light with a spectrometer. Coupling the spectrometer to a microscope with a mapping stage allows an accurate way to create a chemical map of a film’s composition and structure. The map provides valuable information to better understand the packaging’s barrier properties, structural integrity and layers.
The RS method can be useful for conducting failure analysis (why did a food package fail to meet standards), supply chain validation (is the plastic what the supplier claims), decision making (which plastic should be used), and evaluating package appearance (why is there discoloring, haze or particle inclusions in the film). It provides important information for design, purchasing, product success and other decisions that food manufacturers and packagers regularly face.
Take for example the packaging used for frozen hamburger patties. The film used must be transparent to display the hamburger patties, but it also needs to provide an oxygen barrier in order to prevent the ground beef from turning brown. As such, a polymer layer with low oxygen permeability must be incorporated into the laminated film, along with other components like nylon for strength and polyethylene for heat sealing and water barrier. The most common polymer used as an oxygen barrier is ethylene-vinyl alcohol copolymer (EVOH).
It is important that the film used to package these hamburger patties includes a good heat seal as well as a proper oxygen barrier layer. The possible absence of either of these could result in the undesired effect of ground beef turning brown. Manufacturers may want to test packaging for an EVOH layer to make a purchasing decision or verify a supplier’s claims. Additionally, if the packaging fails, an analysis can determine if the failure was due to having no EVOH barrier layer in the product or if there is a need to investigate other potential issues with the packaging. Regardless of the reason, RS provides a preferable method for rapidly evaluating the plastic for an EVOH oxygen barrier layer.
The RS method can be used to determine the construction of the laminated film and confirm that it meets specifications. Using the combination of RS with microscopy and mapping allows both identification of the polymers and the evaluator to correlate the composition to the layer structure of the laminated film. This method provides a map showing the composition of each layer in the film. In some cases, the Raman map will show layers that are not resolved in the visible micrograph image. Thus, with RS, one test provides both the structure and composition of each layer of the laminated film.
This sample table illustrates composition and thickness of each layer of a laminated film. Table courtesy of Intertek.
To start, a small section of the film (5 x 10 mm) is cut and mounted with a photocuring resin. A cross section of the mounted film is then cut to expose the layers for analysis. This cross-section is placed on the mapping microscope stage of the Raman instrument. A micrograph image with a 100X objective is obtained and a Raman map of the cross-section with 1 µm2 pixel resolution collected.
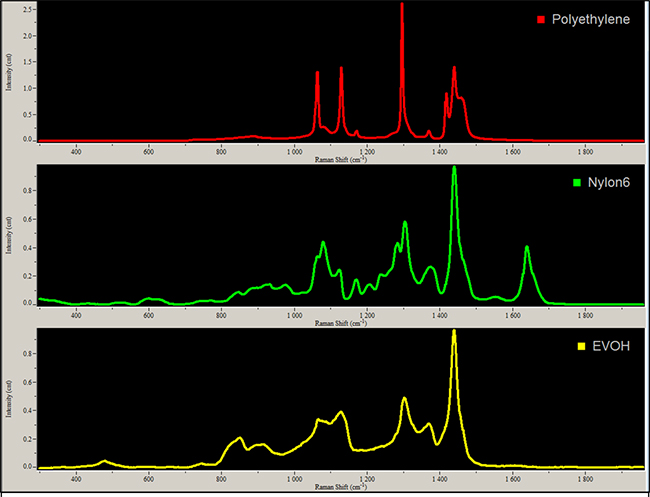
A map image is obtained by classical least squares (CLS) fitting example spectra to each of the spectra collected from the cross-section. The example spectra for the CLS fits are averages (mean) of the spectra in the center of each layer with a unique composition as determined by the data (see Figure 1). The final result is a color-coded map that can be superimposed on the micrograph image to show the composition and thickness of each layer in the laminated film. For example, a film with six layers composed of Nylon 6, polyethylene or EVOH would have varying thickness and placement of each layer to achieve the desired result for the product.
Figure 1. Example spectra used to create the CLS model for map image.
The composition map can confirm the presence of an oxygen barrier layer of EVOH, as well as the overall construction of the laminated film. Knowing the thickness of the barrier layer is important since the gas permeability is a function of the film thickness. Determination of the overall film structure allows the end-user to confirm the film meets the specifications from the supplier. In turn, this can be used to make important purchasing decisions or insights into what caused a packaging failure.
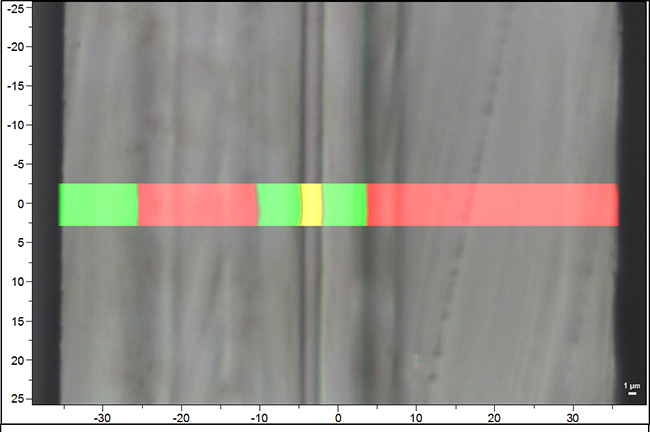
While good, successful results will confirm the presence of an EVOH layer, the RS map may also show only polymers that don’t have the required oxygen barrier properties (see Figure 2). The manufacturer would need to check it against a supplier spec sheet. It may ultimately show that the lack of an EVOH layer is what caused the issue with the packaging. If the test is being used for decision-making purposes, the manufacturer would know not to use the product. If a supply chain validation is being run, after checking the spec sheet, the manufacturer may need to correct the situation.
Figure 2. Raman map overlaid with image of film cross section. Green = nylon; Red = polyethylene; Yellow = ethylene vinyl alcohol copolymer (EVOH).
What if the analysis confirmed that an EVOH layer was present, but the test was done for a failure analysis, meaning the packaging did fail at some point? If the EVOH later is present but the meat is still turning brown and/or spoiling, other potential problems would need to be evaluated. In this case, the issues would most likely be with the heat seal and additional testing of the heat seal would be necessary. Thanks to the RS analysis, the investigation into the packaging failure can proceed, and the issue with the heat seal identified.
By giving a chemical image of the packaging, RS analysis provides a wealth of information about a film that can be vital to a food manufacturer or processor. Knowing why certain films may not be working, either due to faults in chemical makeup or the need to look elsewhere, such as the heat seal, RS quickly and efficiently provides information and answers to help get products to market and meet consumer demand.
Almost everybody loves chocolate, an ancient, basic, almost universal and primal source of pleasure. “The story of chocolate beings with cocoa trees that grew wild in the tropical rainforests of the Amazon basin and other areas in Central and South America for thousands of years… Christopher Columbus is said to have brought the first cocoa beans back to Europe from his fourth visit to the New World” between 1502 and 1504.1
Unfortunately, the production of chocolate and chocolate products today is as complex as any other global food product with supply chains that reach from one end of the world to the other. The complexity of the supply chain and production, along with the universal demand for the finished product, exposes chocolate to increasing pressure from numerous hazards, both unintentional and intentional. For example, we know that more than 70% of cocoa production takes place in West African countries, particularly the Ivory Coast and Ghana. These regions are politically unstable, and production is frequently disrupted by fighting. While production has started to expand into more stable regions, it has not yet become diversified enough to normalize the supply. About 17% of production takes place in the Americas (primarily South America) and 9% from Asia and Oceania.2
In today’s world of global commerce these pressures are not unique to chocolate. Food quality and safety experts should be armed with tools and innovations that can help them examine specific hazards and fraud pertaining to chocolate and chocolate products. In fact, the global nature of the chocolate market, requires fast reflexes that protect brand integrity and dynamic quality processes supported by informed decisions. Digital tools have become a necessity when a fast interpretation of dynamic data is needed. If a food organization is going to effectively protect the public’s health, protect their brand and comply with various governmental regulations and non-governmental standards such as GFSI, horizon scanning, along with the use of food safety intelligent digital tools, needs to be incorporated into food company’s core FSQA program.
This article pulls information from a recent industry report about chocolate products that presents an examination of the specific hazards and fraud pertaining to chocolate and chocolate products along with ways to utilize this information.
Cocoa and chocolate products rely on high quality ingredients and raw materials, strict supplier partnership schemes and conformity to clearly defined quality and safety standards. During the past 10 years there have been a significant number of food safety incidents associated with chocolate products. The presence of Salmonella enterica, Listeria monocytogenes, allergens and foreign materials in cocoa/chocolate products have been reported on a global scale. Today, information on food safety incidents and potential risks is quickly and widely available by way of the internet. However, because the pertinent data is frequently siloed, food safety professionals are unable to take full advantage of it.
Top Emerging Hazards: Chocolate Products (2013-2018)
Publicly available data, from sources such as European Union RASFF, Australian Competition and Consumer Commission, UK Food Standards Agency, FDA, Food Standards Australia New Zealand (FSANZ), shows a significant increase in identified food safety incidents for cocoa/chocolate products from 2013 to 2018. For this same time period, the top emerging hazards that were identified for chocolate products were the following:
Allergens: 51.60%
Biological: 16.49%
Foreign bodies: 13.83%
Chemical: 7.45%
Fraud: 6.38%
Food additives & flavorings: 4.26%
Other hazards: 2.66%
By using such information to identify critical food safety protection trends, which we define to include food safety (unintentional adulteration) and food fraud (intentional adulteration, inclusive of authenticity/intentional misrepresentation) we can better construct our food protection systems to focus on the areas that present the greatest threats to public health, brand protection and compliance.
A Data Driven Approach
Monitoring Incoming Raw Materials
Assessment and identification of potential food protection issues, including food safety and fraud, at the stage of incoming raw materials is of vital importance for food manufacturers. Knowledge of the associated risks and vulnerabilities allows for timely actions and appropriate measures that may ultimately prevent an incident from occurring.
Specifically, the efficient utilization of global food safety and fraud information should allow for:
Identification of prevalent, increasing and/or emerging risks and vulnerabilities associated with raw materials
Comparative evaluation of the risk profile for different raw materials’ origins
Critical evaluation and risk-based selection of raw materials’ suppliers
A comprehensive risk assessment must start with the consideration of the identified food safety incidents of the raw material, which include the inherent characteristics of the raw material. Next, the origin-related risks must be taken into account and then the supplier-related risks must be examined. The full risk assessment is driven by the appropriate food safety data, its analysis and application of risk assessment scientific models on top of the data.
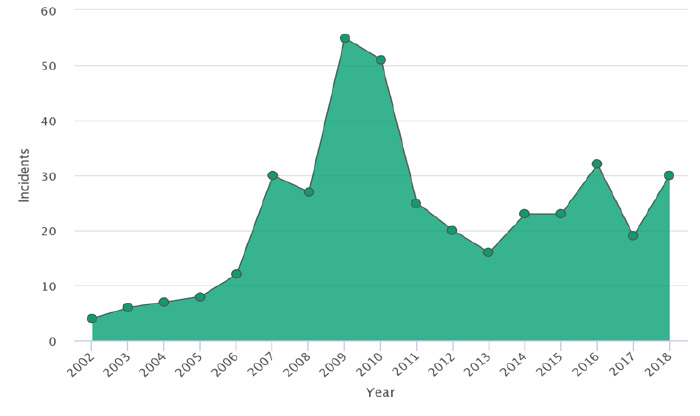
Using food safety intelligent digital tools to analyze almost 400 unique, chocolate product related food safety incidents around the globe provides us with important, useful insights about cocoa as a raw material, as a raw material from a specific origin and as a raw material being provided by specific suppliers. The graph below represents the results of the analysis illustrating the trend of incidents reported between 2002 and 2018. It can be observed that after a significant rise between 2009 and 2010, the number of incidents approximately doubled and remained at that level for the rest of the evaluated period (i.e., from 2010 to 2018), compared to the period from 2002 to 2005.
By further analyzing the data stemming from the 400 food safety incidents and breaking them down into more defined hazards, for incoming raw materials, we can clearly see that chemical hazards represent the major hazard category for cocoa.
Chemical: 73.46%
Biological: 16.49%
Organoleptic aspects: 5.93%
Other Hazards: 4.38%
Fraud: 2.32%
Foreign bodies: 2.06%
Food additives and flavorings: .77%
Allergens: .52%
Food contact materials: .52%
Using the appropriate analytical tools, someone can drill down into the data and identify the specific incidents within the different hazard categories. For example, within the “chemical hazard” category specific hazards such as organophosphates, neonicotinoids, pyrethroids and organochlorines were identified.
Comparative Evaluation of Risk Profiles for Different Origins of Raw Materials
The main regions of origin for cocoa globally are Africa, Asia and South America. After collecting and analyzing all relevant data from recalls and border rejections and the frequency of pertinent incidents, we can accurately identify the top hazards for cocoa by region.
The top five specific hazards for the regions under discussion are listed in Table I.
Africa
South America
Asia
1
Organophosphate
2,4-dinitrophenol (DNP)
2,4-dinitrophenol (DNP)
2
Molds
Pyrethroid
Poor or insufficient controls
3
Neonicotinoid
Aflatoxin
Aflatoxin
4
Pyrethroid
Cadmium
Spoilage
5
Organochlorine
Anilinopyrimidine
Salmonella
Table I. Top Five Hazards By Region
After the first level of analysis, a further interpretation of the data using the appropriate data intelligence tools can help to reach to very specific information on the nature of the incidents. This provides additional detail that is helpful in understanding how the regional risk profiles compare. For example, the prevalence of chemical contamination, as either industrial contaminants or pesticides, has been a commonly observed pattern for all three of the regions in Table I. However, beyond the general hazard category level, there are also different trends with regard to specific hazards for the three different regions. One such example is the increased presence of mold in cocoa beans coming from Africa.
The primary hazard categories for cocoa, as a raw ingredient were identified and a comparison among the primary hazards for cocoa by region (origin-specific) should take place. The next step in a data-powered supplier assessment workflow would be to incorporate our use of global food safety data in evaluating the suppliers of the raw materials.
The Role of Global Food Safety Data
This article has been focused on chocolate products but has only touched the surface in terms of the information available in the complete report, which also includes specific information about key raw materials. Let’s also be clear, that the techniques and tools used to generate this information are applicable to all food products and ingredients. As we strive to produce food safely in the 21st Century and beyond, we must adapt our methods or be left behind.
The regulatory environment the food industry must operate in has never been more intense. The threats to an organization’s brand have never been greater. This is not going to change. What must change is the way in which food companies confront these challenges.
Global food safety data can contribute to the establishment of an adaptive food safety/QA process that will provide time savings and improve a quality team’s efficiency and performance.
Based on the continuous analysis of food recalls and rejections by key national and international food authorities, a food safety / quality assurance manager could establish an adaptive supplier verification process and risk assessment process by utilizing the knowledge provided by such data. In that way, QA, procurement, food safety and quality departments can be empowered with critical supplier data that will inform the internal procedures for incoming materials and ingredients (e.g., raw materials, packaging materials) and allow for adaptive laboratory testing routines and compliance protocols. Moreover, food safety systems can become adaptive, enabling quality assurance and safety professionals to quickly update points of critical control when needed, and intervene in important stages of the chocolate manufacturing process.
Laminated plastics are common and popular food packaging options. They are strong and flexible, making them ideal for both packing and presentation, and can be used for cooking, frozen foods, drink pouches, snack products and even pet food. Yet, unreliable plastics can create a problem for food packaging and the safety of a product.
If a grade of plastic is not what was promised or needed, there can be issues that lead to spoilage, spills and messes, crystallization, mold or other risks. Additionally, there may be concerns about how laminated films will interact with the product itself, as it could impact food safety or lifecycle. For these reasons, it is critical to have accurate information when evaluating the plastics films used in food packaging.
Raman Spectroscopy
Raman spectroscopy (RS) is a powerful method of identifying and characterizing chemical compounds based on light scattering by a sample. It can be used to identify layers in food packaging films to accurately understand the chemical makeup of the laminated plastic. The effect is named for its inventor, C.V. Raman, who was awarded the Nobel prize in physics for its discovery in 1930. It is a non-destructive method that uses an induced-dipole mechanism to probe the vibrations of the chemical bonds in a molecule. The Raman spectrum shows a pattern of molecular vibrations that represents a detailed chemical fingerprint of a material, providing insights into the product composition.
A Raman spectrum is obtained by illuminating the sample with a laser and collecting and measuring the scattered light with a spectrometer. The molecular vibrational modes vary depending on the geometry and electronic structure of the chemical compound present in the sample. By controlling the position of the laser focus point on a sample, a map of the composition can be created. This provides valuable information on the plastic film related to its composition, such as number of layers, thickness of each layer and overall make-up.
In the food packaging and safety industry, this technique can be used to evaluate laminated plastic films by examining polymers, minerals, and/or inorganic fillers and pigments present in the film. Specific food packaging products that can benefit from RS assessments include heat seals, containers, lids, films and wrappers both for durability and performance and for diffusion, permeation or other concerns.
Benefits and Limitations
There are numerous benefits to using the RS method. A major advantage is that there is virtually no sample preparation necessary; spectra can be obtained without direct contact, such as through the sides of glass vials or through windows in reaction cells. As a non-destructive technique, it allows an easy, highly accurate way to take a sample, create a chemical composition map and better understand films’ barrier properties, structural integrity and layers. It has broad applicability and works using conventional microscope optics.
There are, of course, limitations to the approach, as well. Fluorescent components or impurities in a sample can emit a photoluminescent background that overwhelms the Raman scattering. Samples can also be damaged by the laser if too much power is used, or the sample absorbs light at the laser wavelength. Samples that do fluoresce and samples that are photolabile act as common interferences for the RS method. In many cases, these interferences can be overcome with the proper choice of laser and sampling techniques. Additionally, while RS provides an accurate analysis of laminated films, the technique cannot be used on metals or metallic compounds (which can be assessed using scanning electron microscopy or light optical microscopy) or organic pigments or ink layers (which can be assessed with other infrared techniques).
Using RS for Food Packaging
RS can offer a variety of insights for food packaging films:
Failure analysis. If a plastic used for a heat seal in a fruit or yogurt cup fails, it could result in a mess for manufacturers, stores or the consumer. Exposure to air or elements could also lead to spoilage, particularly for refrigerated foods. Inconsistent plastic packaging could result in weak points that break, crack or puncture, which could also result in mold, mess or other spoilage concerns. If a manufacturer experiences a failure in a heat seal or packaging leading to leakage or spoilage, RS analysis can help determine why the failure occurred (was in the plastic film or something else) to help prevent future issues.
Supply chain validation. It is extremely important that the plastic films coming from suppliers are what they are promising and what the manufacturer needs. RS analysis can be used to determine the chemical make-up and morphology of packaging to confirm a supplier’s claims before proceeding with use of the film in food packaging and products.
Simple decision making. If a manufacturer is trying to decide which material to use, RS can provide answers. For example, if there is a need for moisture non-permeating films and there are multiple options available, an RS chemical map can illustrate what to expect with each option, aiding in the decision-making process when combined with other known factors such as cost or timing. If there is an additive in the food product that may diffuse into the film, RS can determine which material might best resist the potential problem.
Packaging appearance. If there is a swirl or haze in the packaging, RS can compare the area with the issue to a clear section to determine if the defect in the film is a foreign polymer or an inorganic pigment or filler, identifying the source of the problem.
RS analysis provides a wealth of information in a manner that is non-destructive. Giving a chemical fingerprint to identify composition with extremely good spatial resolution gives manufacturers valuable information that can be used to mitigate issues, correct problems or make important decisions. These actions in turn can help ensure food safety, which builds brand image and manufacturer equity. Ultimately, RS analysis can play an important role in the success of a product, a brand or a company.
Find records of fraud such as those discussed in this column and more in the Food Fraud Database. Image credit: Susanne Kuehne.
In a large study of nearly 6000 products, more than a quarter (27%) of herbal medicines and foods sold in 37 countries on six continents was found to be deliberately or accidentally adulterated. In this study, the products, which came in a variety of forms such as softgels, tea and more, were analyzed with high throughput DNA sequencing and showed mislabeling, added fillers, substituted ingredients or contaminants. Such fraud can be a harmful to consumer health and safety, and must be monitored and tracked closely.
Resource
Ichim, M.C. (October 24, 2019). “The DNA-Based Authentication of Commercial Herbal Products Reveals Their Globally Widespread Adulteration”. “Stejarul” Research Centre for Biological Sciences, National Institute of Research and Development for Biological Sciences, Piatra Neamt, Romania. Frontiers in Pharmacology. Retrieved from https://www.frontiersin.org/articles/10.3389/fphar.2019.01227/full.
Today FDA released the results of its yearly report on pesticide residues, and the good news is that of the 6504 samples taken, most of them were below EPA tolerance levels. As part of the Pesticide Residue Monitoring Program for FY 2017, FDA tested for 761 pesticides and industrial chemicals in domestic and imported foods for animals and humans. The following are some highlights of the FDA’s findings:
Percentage of foods compliant with federal standards
96.2% of domestic human foods
89.6% of imported human foods
98.8% domestic animal foods
94.4% imported animal foods
Percentage of food samples without pesticide residues
Milk and game meat: 100%
Shell egg: 87.5%
Honey: 77.3%
Percentage of food samples without glyphosate or glufosinate residues
Milk and eggs: 100%
Corn: 82.1%
Soybeans: 60%
“Ensuring the safety of the American food supply is a critical part of the work of the U.S. Food and Drug Administration. Our annual efforts to test both human and animal foods for pesticide residues in foods is important as we work to limit exposure to any pesticide residues that may be unsafe,” said Susan Mayne, Ph.D., director of FDA’s CFSAN, in an agency release. “We will continue to do this important monitoring work, taking action when appropriate, to help ensure our food supply remains among the safest in the world.”
Dioxins are highly toxic organic compounds that can remain in the environment for extended periods. These persistent organic pollutants (POPs), which include polychlorinated dibenzo-p-dioxins (PCDDs) and polychlorinated dibenzofurans (PCDFs), are mainly generated by the combustion or manufacture of chlorine-containing materials such as plastics. Dioxins and other closely related POPs, such as polychlorinated biphenyls (PCBs), are classed as carcinogenic by the United States Environmental Protection Agency, and present a significant threat to human health even at low levels.
Dioxins and PCBs can enter the food chain when livestock consume contaminated animal feed, and can accumulate in the fatty tissues of animals due to their high fat-solubility. As a result, over 90% of human exposure to dioxins and PCBs is through the consumption of meat, fish, dairy and other foods of animal origin.1 Given the health risks posed by dioxins and PCBs, effective food testing workflows are essential to ensure products do not exceed regulatory-defined safe levels.
GC-MS/MS: A Robust Technique for Analyzing Dioxins and PCBs in Food and Animal Feed
To control human exposure to PCDDs, PCDFs and PCBs from the food chain, global regulatory bodies have established maximum levels (MLs) and action levels (ALs) for various POPs in food products, as well as approved analytical methods for food testing laboratories to enforce these standards. In the European Union (EU), for example, European Commission regulations 2017/644 and 2017/771 outline sampling, sample preparation and analysis protocols for the detection of dioxins and other dioxin-like compounds in food and animal feedstuffs.2,3
With food testing laboratories tasked with handling potentially hundreds of samples every day, these workflows must be supported by robust and reliable analytical technologies that can confidently identify and accurately quantify dioxins and PCBs with minimal maintenance requirements in order to minimize downtime and maximize throughput.
Thanks to ongoing improvements in the robustness and sensitivity of gas chromatography-triple quadrupole mass spectrometry (GC-MS/MS) systems, regulations were updated in 2014 to permit this technique as an alternative to gas chromatography-high resolution mass spectrometry (GC-HRMS) for confirmatory analysis and for the control of MLs and ALs. The latest GC-MS/MS systems are capable of exceptionally reliable performance for the routine analysis of dioxins and PCBs, providing accurate and sensitive quantification of these compounds even at trace levels.
Case Study: Sensitive and Reliable Determination of Dioxins Using GC-MS/MS
The performance of modern GC-MS/MS systems was evaluated in a recent study involving the confirmatory analysis and quantification of 17 PCDDs and PCDFs, and 18 dioxin-like and non-dioxin-like PCBs in solvent standards and various food and feedstuff samples. The samples were analyzed using a triple quadrupole GC-MS/MS system equipped with the advanced electron ionization source (AEI) and a TG-Dioxin capillary GC column. Two identical GC-MS/MS systems in two separate laboratories were used to assess the reproducibility of the method.
Extraction was performed by Twisselmann hot extraction or pressurized liquid extraction. The automated clean-up of the extracts was performed using a three-column setup, comprising multi-layered acidic silica, alumina and carbon columns. Two fractions were generated per sample (the first containing non-ortho PCBs, PCDDs and PCDFs, and the second containing mono-ortho and di-ortho PCBs and indicator PCBs) and these were analyzed separately. The analytical method gave excellent separation of all the PCDD, PCDF and PCB congeners in less than 45 minutes.
Given the high sensitivity of modern GC-MS/MS instruments, a calibration-based approach was used to determine limits of quantitation (LOQs) of the analytical system. Using calibration standards at the LOQ and subsequent check standards at this level enabled the performance of the method to be assessed throughout the analytical sequence. This also allowed LOQs for the individual congeners to be determined, assuming a fixed sample weight. Individual congener LOQs could be applied to upper-bound, middle-bound and lower-bound toxicity equivalence (TEQ) results by substituting the result of any congener that fell below the lowest calibration point with this value multiplied by the toxicity equivalence factor (TEF) of the congener.
To evaluate the response factor deviation over the course of the analytical sequences, standards at the specified LOQ were analyzed at the start, during and end of each run. Using a nominal weight of 2 g, and assuming 100% 13C-labeled standard recovery and all natives were less than the LOQ in the sample, a minimum upper-bound value of 0.152 pg/g WHO-PCDD/F-TEQ was determined. This met regulatory requirements for reporting at 1/5th of the ML upper-bound sum TEQ for all food and feedstuffs with a nominal intake of 2 g, with the exception of guidance associated with liver of terrestrial animals and food for infants or young children, which both have legal limits defined on a fresh weight basis. In these cases, either a larger sample intake or a magnetic sector instrument would be required. All of the calibration sequences demonstrated response factor %RSDs within EU regulations, highlighting the suitability of the method.
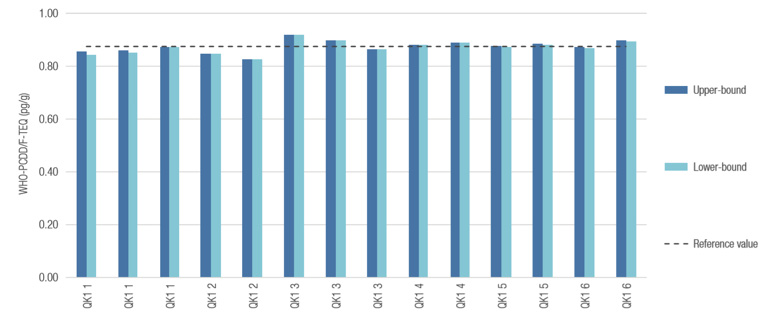
To demonstrate the performance of the GC-MS/MS system, six replicate extractions of a mixed fat quality control sample (QK1) were prepared, split between the two sites and analyzed at regular intervals throughout the analytical sequences (14 injections in total). The measured WHO-PCDD/F-TEQ values for congener were in excellent agreement with the reference value provided by the EU Reference Laboratory for Halogenated POPs in Feed and Food, and the upper bound WHO-PCDD/F-TEQ value did not deviate by more than 6% from the reference value for all 14 measurements (Figure 1). The deviation between the upper-bound and lower-bound WHO-PCDD/F-TEQ for each measurement was consistently less than 1.2%, well below the maximum limit of 20% necessary to support compliance with EU regulations.
Figure 1. Upper- and lower-bound WHO-PCDD/F-TEQ values for all 14 measurements of the QK1 mixed animal fat quality control sample, for six replicate extractions.
Robust Routine Analysis of Dioxin and Dioxin-like Compounds
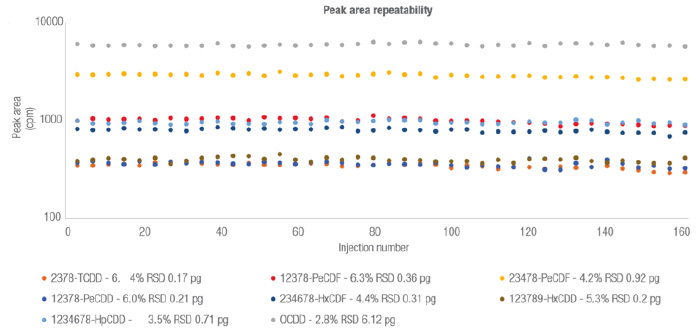
To assess the robustness of the GC-MS/MS system, the PCDD, PCDF and non-ortho PCB extracts were pooled into a mixed matrix sample and analyzed more than 161 injection sequences across a period of approximately two weeks. Each sequence consisted of 40 matrix injections and 40 LOQ standards, interspersed with nonane blanks. No system maintenance, tuning or user intervention was undertaken throughout the two-week study. Figure 2 highlights the exceptional peak area stability achieved for selected PCDD and PCDF congeners.
Figure 2. Absolute peak area repeatability over two weeks of analysis for selected PCDD and PCDF congeners in a pooled matrix sample (%RSD and amounts on column are shown for each congener).
These results highlight the exceptional levels of day-to-day measurement repeatability offered by the latest GC-MS/MS systems. By delivering consistently high performance without the need for extensive maintenance steps, modern GC-MS/MS systems are maximizing instrument uptime and increasing sample throughput for routine POP analysis workflows.
Conclusion
Developments in GC-MS/MS technology, namely the advanced electron ionization source, are pushing the limits of measurement sensitivity, repeatability and robustness to support the needs of routine dioxin and PCBs analysis in food and feed samples. By minimizing instrument downtime while maintaining exceptional levels of analytical performance, these advanced systems are helping high-throughput food testing laboratories to analyze more samples and ultimately better protect consumers from these harmful pollutants.
References
Malisch, R. and Kotz, A. (2014) Dioxins and PCBs in feed and food – Review from European perspective. Sci Total Environ, 491, 2-10.
European Commission. Commission Regulation (EU) 2017/644, Off J Eur Union, 2017, L92 9-34.
European Commission. Commission Regulation (EU) 2017/771, Off J Eur Union, 2017, L115 22-42.
Acknowledgements
This article is based on research by Richard Law and Cristian Cojocariu (Thermo Fisher Scientific, Runcorn, UK), Alexander Schaechtele (EU Reference Laboratory for Halogenated POPs in Feed and Food, Freiburg, Germany), Amit Gujar (Thermo Fisher Scientific, Austin, US), and Jiangtao Xing (Thermo Fisher Scientific, Beijing, China).
The 2019 Food Safety Consortium Conference & Expo kicks off on Tuesday, October 1 and is packed with two-and-a-half days of informative sessions on a variety of topics that are critical to the food safety industry. We invite you to check out the full agenda on the event website, but below are several event highlights that you should plan on attending.
Opening Keynote: Frank Yiannas, Deputy Commissioner for Food Policy and Response, FDA
Recalls Panel Discussion: Led by Rob Mommsen, Director of Global Quality & Food Safety, Sabra Dipping Company
Food Defense Panel: Led by Steven Sklare, REHS, CP-FS, LEHP. Invited Panelists include Jason P. Bashura, MPH, RS, Sr. Mgr., Global Food Defense, PepsiCo and Jill Hoffman, Director, Global Quality Systems and Food Safety at McCormick & Company and Clint Fairow, M.S. Global Food Defense Manager, Archer Daniels Midland Company
“Validation Considerations and Regulations for Processing Technologies”: General Session presented by Glenn Black, Ph.D., Associate Director for Research, Division of Food Processing Science and Technology (DFPST), Office of Food Safety (OFS), CFSAN, FDA
“Food Safety Leadership: Earning respect – real-life examples of earning and maintaining influence as a Food Safety leader”: Panel Discussion moderated by Bob Pudlock, President, Gulf Stream Search
Supply Chain Transparency Panel Discussion: Led by Jeanne Duckett of Avery Dennison
Taking an Aggressive Approach to Sanitation: Planning for a Contamination Event: Presented by Elise Forward, President, Forward Food Safety
Three Breakout Tracks: Food Safety Leadership; Food Testing & Analysis and Sanitation and Operations
Register by September 13, 2019 for a special discount!
Watch this video from when Frank Yiannas was the vice president of food safety at Walmart. He presented at the 2015 Food Safety Consortium.
Watch this video of Steven Sklare speaking with Aaron Biros of Cannabis Industry Journal at the 2017 Food Safety Consortium.
In a two-question format, the authors discuss pressing issues in food fraud.
1. Where are the current hot spots for food fraud?
Food fraud activities have been known for centuries. For example, in ancient Rome and Athens, there were rules regarding the adulteration of wines with flavors and colors. In mid-13th century England, there were guidelines prescribing a certain size and weight for each type of bread, as well as required ingredients and how much it should cost. In the United States, back in 1906, Congress passed both the Meat Inspection Act and the original Food and Drugs Act, prohibiting the manufacture and interstate shipment of adulterated and misbranded foods and drugs. However, evidence and records of actions taken over those events were not officially collected.
It was not until 1985, when the presence of diethylene glycol (DEG) was identified in white wines from Austria, that authorities, retailers and consumers started to have serious concerns about the adulteration of food and the severity of its impact on consumers. In addition, there was increased interest to regulate, investigate and apply efforts to enforce requirements.
Other examples include the following:
2005: Chili powder adulterated with Sudan (India)
2008: Dairy products adulterated with melamine (China)
2013: Beef substituted with horsemeat (UK)
2013: Manuka honey where it was known that bees were not feeding from pollen of the Manuka bush (New Zealand)
2016: Dried oregano adulterated with other dried plants (Australia)
This list can go on and on.
Lately there have been more cases of food fraud. Fortunately, even limited international databases are helping to identify the raw material origins of products in the supply chain that could be more exposed to adulteration. Also, food manufacturers, brokers and agents are conducting assessments to ensure that they are buying ingredients and products from sources, where food fraud could be prevented. The following products are identified as having more adulteration notifications:
Olive oil
Fish
Vegetable products with claims of “Organic”
Milk
Grains
Honey and maple syrup
Coffee and tea
Spices
Wine
Fruit Juices
2. What can companies do to mitigate the risk?
Control measures to prevent food fraud activities include the adequate evaluation and selection of suppliers, as well as the ‘suppliers of the suppliers’. Typical risk matrices of likelihood of occurrence versus consequence can be used to measure risk—and determine priorities for assessing and putting control measures in place. Assessments can be focused on points of vulnerabilities such as food substitution, mislabeling, adulterations and/or counterfeiting, usually due to economic advantages for one or more tiers in food chain production.
Other food fraud activities include effective traceability systems, monitoring current worldwide news and notifications on food fraud using international databases (EU-RASFF, USA- EMA NCFPD and USP, etc.), and product testing.
Product testing is becoming an important tool for the food industry to become confident in sourcing raw materials, ensuring the management of food fraud control measures, fulfilling applicable legal requirements, and ensuring the safety of consumers.
Product testing laboratories offer different kinds of testing methods depending on the required output; for example, if it is possible and requested, a targeted or non-targeted result.
Targeted analysis involves screening for pre-defined components in a sample:
Liquid chromatography
Gas chromatography
Mass spectrometry (LC-MS and GC-MS)
Nuclear magnetic resonance spectroscopy (NMR).
PCR technique
Non-targeted analysis aims to see any chemical present in the sample:
Isotopic measurement-determination of whether ethanol and vinegar and flavorings are natural or synthetic
Metabolomics: Maturation and shelf life
Proteomics: Testing for pork and beef additives in chicken, confectionery and desserts
Due to the importance of food fraud for a food safety management system, GFSI published Version 7.1 of Benchmarking Requirements, including subjects on food fraud, as vulnerability assessment. In 2018 all certification schemes have incorporated such requirements and started enforcing them.
Fraud cases threat consumer trust in products and services. Companies are learning to “think like a criminal” and put in place measures to prevent fraud and protect their products, their brands and their consumers.
FlexXray will be exhibiting at the 2016 Food Safety Consortium in Schaumburg, IL. At the booth representing FlexXray will be CEO Kevin Fritzmeyer and Project Manager John Hower. They will be discussing their food inspection process and capabilities of foreign material detection.
FlexXray is the leader in Inspection & Recovery Services dedicated to serving food companies. The company X-rays food products for various types of foreign material and contaminants, which it can see down to 0.8 mm or even smaller. Metal, plastic, gasket material, glass, stones and bone are a few of the items our customers ask us to inspect for.
FlexXray provides quick turn IN/OUT service, your truckload of product is inspected, contaminants removed and returned in only 8-12 hours. The company has introduced a new audit program for our customers to conform to the new HACCP and FSMA regulations. It is meant to help catch and prevent problems before recalls occur.
Our goal is to work with food companies to inspect their finished product for foreign material versus their other option, throwing it away. We strive to provide your company a cost-effective option in the event that you have an incident.
This website uses cookies so that we can provide you with the best user experience possible. Cookie information is stored in your browser and performs functions such as recognising you when you return to our website and helping our team to understand which sections of the website you find most interesting and useful.
Strictly Necessary Cookies
Strictly Necessary Cookies should be enabled at all times so that we can save your preferences for these cookie settings.
We use tracking pixels that set your arrival time at our website, this is used as part of our anti-spam and security measures. Disabling this tracking pixel would disable some of our security measures, and is therefore considered necessary for the safe operation of the website. This tracking pixel is cleared from your system when you delete files in your history.
We also use cookies to store your preferences regarding the setting of 3rd Party Cookies.
If you visit and/or use the FST Training Calendar, cookies are used to store your search terms, and keep track of which records you have seen already. Without these cookies, the Training Calendar would not work.
If you disable this cookie, we will not be able to save your preferences. This means that every time you visit this website you will need to enable or disable cookies again.
Cookie Policy
A browser cookie is a small piece of data that is stored on your device to help websites and mobile apps remember things about you. Other technologies, including Web storage and identifiers associated with your device, may be used for similar purposes. In this policy, we say “cookies” to discuss all of these technologies.
Our Privacy Policy explains how we collect and use information from and about you when you use This website and certain other Innovative Publishing Co LLC services. This policy explains more about how we use cookies and your related choices.
How We Use Cookies
Data generated from cookies and other behavioral tracking technology is not made available to any outside parties, and is only used in the aggregate to make editorial decisions for the websites. Most browsers are initially set up to accept cookies, but you can reset your browser to refuse all cookies or to indicate when a cookie is being sent by visiting this Cookies Policy page. If your cookies are disabled in the browser, neither the tracking cookie nor the preference cookie is set, and you are in effect opted-out.
In other cases, our advertisers request to use third-party tracking to verify our ad delivery, or to remarket their products and/or services to you on other websites. You may opt-out of these tracking pixels by adjusting the Do Not Track settings in your browser, or by visiting the Network Advertising Initiative Opt Out page.
You have control over whether, how, and when cookies and other tracking technologies are installed on your devices. Although each browser is different, most browsers enable their users to access and edit their cookie preferences in their browser settings. The rejection or disabling of some cookies may impact certain features of the site or to cause some of the website’s services not to function properly.
Individuals may opt-out of 3rd Party Cookies used on IPC websites by adjusting your cookie preferences through this Cookie Preferences tool, or by setting web browser settings to refuse cookies and similar tracking mechanisms. Please note that web browsers operate using different identifiers. As such, you must adjust your settings in each web browser and for each computer or device on which you would like to opt-out on. Further, if you simply delete your cookies, you will need to remove cookies from your device after every visit to the websites. You may download a browser plugin that will help you maintain your opt-out choices by visiting www.aboutads.info/pmc. You may block cookies entirely by disabling cookie use in your browser or by setting your browser to ask for your permission before setting a cookie. Blocking cookies entirely may cause some websites to work incorrectly or less effectively.
The use of online tracking mechanisms by third parties is subject to those third parties’ own privacy policies, and not this Policy. If you prefer to prevent third parties from setting and accessing cookies on your computer, you may set your browser to block all cookies. Additionally, you may remove yourself from the targeted advertising of companies within the Network Advertising Initiative by opting out here, or of companies participating in the Digital Advertising Alliance program by opting out here.