Raman spectroscopy (RS) can be used to identify layers in polymer food packaging films to better understand the laminated plastic’s chemical composition. A Raman spectrum is obtained by illuminating a sample with a laser and collecting and measuring scattered light with a spectrometer. Coupling the spectrometer to a microscope with a mapping stage allows an accurate way to create a chemical map of a film’s composition and structure. The map provides valuable information to better understand the packaging’s barrier properties, structural integrity and layers.
The RS method can be useful for conducting failure analysis (why did a food package fail to meet standards), supply chain validation (is the plastic what the supplier claims), decision making (which plastic should be used), and evaluating package appearance (why is there discoloring, haze or particle inclusions in the film). It provides important information for design, purchasing, product success and other decisions that food manufacturers and packagers regularly face.
Take for example the packaging used for frozen hamburger patties. The film used must be transparent to display the hamburger patties, but it also needs to provide an oxygen barrier in order to prevent the ground beef from turning brown. As such, a polymer layer with low oxygen permeability must be incorporated into the laminated film, along with other components like nylon for strength and polyethylene for heat sealing and water barrier. The most common polymer used as an oxygen barrier is ethylene-vinyl alcohol copolymer (EVOH).
It is important that the film used to package these hamburger patties includes a good heat seal as well as a proper oxygen barrier layer. The possible absence of either of these could result in the undesired effect of ground beef turning brown. Manufacturers may want to test packaging for an EVOH layer to make a purchasing decision or verify a supplier’s claims. Additionally, if the packaging fails, an analysis can determine if the failure was due to having no EVOH barrier layer in the product or if there is a need to investigate other potential issues with the packaging. Regardless of the reason, RS provides a preferable method for rapidly evaluating the plastic for an EVOH oxygen barrier layer.
The RS method can be used to determine the construction of the laminated film and confirm that it meets specifications. Using the combination of RS with microscopy and mapping allows both identification of the polymers and the evaluator to correlate the composition to the layer structure of the laminated film. This method provides a map showing the composition of each layer in the film. In some cases, the Raman map will show layers that are not resolved in the visible micrograph image. Thus, with RS, one test provides both the structure and composition of each layer of the laminated film.

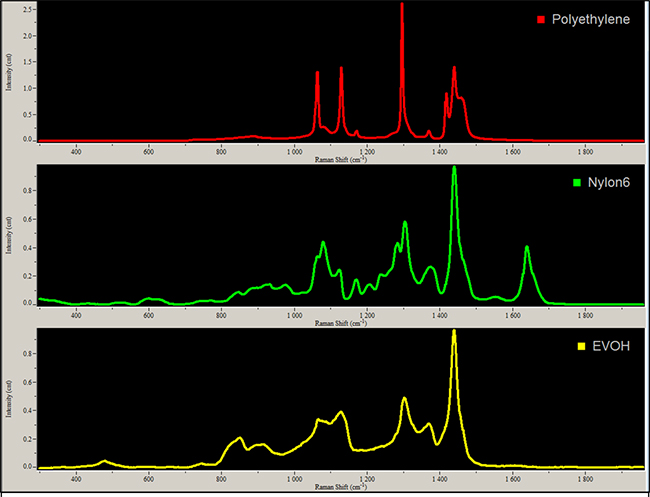
To start, a small section of the film (5 x 10 mm) is cut and mounted with a photocuring resin. A cross section of the mounted film is then cut to expose the layers for analysis. This cross-section is placed on the mapping microscope stage of the Raman instrument. A micrograph image with a 100X objective is obtained and a Raman map of the cross-section with 1 µm2 pixel resolution collected.
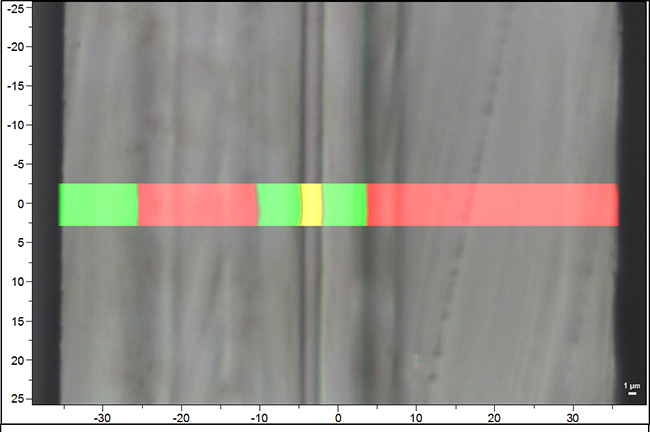
A map image is obtained by classical least squares (CLS) fitting example spectra to each of the spectra collected from the cross-section. The example spectra for the CLS fits are averages (mean) of the spectra in the center of each layer with a unique composition as determined by the data (see Figure 1). The final result is a color-coded map that can be superimposed on the micrograph image to show the composition and thickness of each layer in the laminated film. For example, a film with six layers composed of Nylon 6, polyethylene or EVOH would have varying thickness and placement of each layer to achieve the desired result for the product.
The composition map can confirm the presence of an oxygen barrier layer of EVOH, as well as the overall construction of the laminated film. Knowing the thickness of the barrier layer is important since the gas permeability is a function of the film thickness. Determination of the overall film structure allows the end-user to confirm the film meets the specifications from the supplier. In turn, this can be used to make important purchasing decisions or insights into what caused a packaging failure.
While good, successful results will confirm the presence of an EVOH layer, the RS map may also show only polymers that don’t have the required oxygen barrier properties (see Figure 2). The manufacturer would need to check it against a supplier spec sheet. It may ultimately show that the lack of an EVOH layer is what caused the issue with the packaging. If the test is being used for decision-making purposes, the manufacturer would know not to use the product. If a supply chain validation is being run, after checking the spec sheet, the manufacturer may need to correct the situation.
What if the analysis confirmed that an EVOH layer was present, but the test was done for a failure analysis, meaning the packaging did fail at some point? If the EVOH later is present but the meat is still turning brown and/or spoiling, other potential problems would need to be evaluated. In this case, the issues would most likely be with the heat seal and additional testing of the heat seal would be necessary. Thanks to the RS analysis, the investigation into the packaging failure can proceed, and the issue with the heat seal identified.
By giving a chemical image of the packaging, RS analysis provides a wealth of information about a film that can be vital to a food manufacturer or processor. Knowing why certain films may not be working, either due to faults in chemical makeup or the need to look elsewhere, such as the heat seal, RS quickly and efficiently provides information and answers to help get products to market and meet consumer demand.