

Affiliated Foods Named Inaugural Recipient of the Food Safety Tech Excellence Award

By Candace Taylor
No Comments

Managing food safety across more than 1,000 suppliers is no small undertaking. Different products, different risk levels, different regulatory requirements, and a seemingly endless stream of documentation can make even the most organized food safety professional wonder if there is a better way.

For Santoshi Muriki, Food Safety Manager at Affiliated Foods, Inc. in Amarillo, Texas, the answer was to build one.

The automated risk-based supplier compliance system developed by Santoshi Muriki earned Affiliated Foods the inaugural 2026 Food Safety Tech Excellence Award. The award was presented October 22 at the 15th Annual Food Safety Consortium Conference in Washington, DC.

The award recognizes innovative technical solutions that measurably improve food safety practices. Muriki’s accomplishment stood out for its practical application of technology, measurable operational improvements, and potential relevance to other organizations managing complex supplier networks.
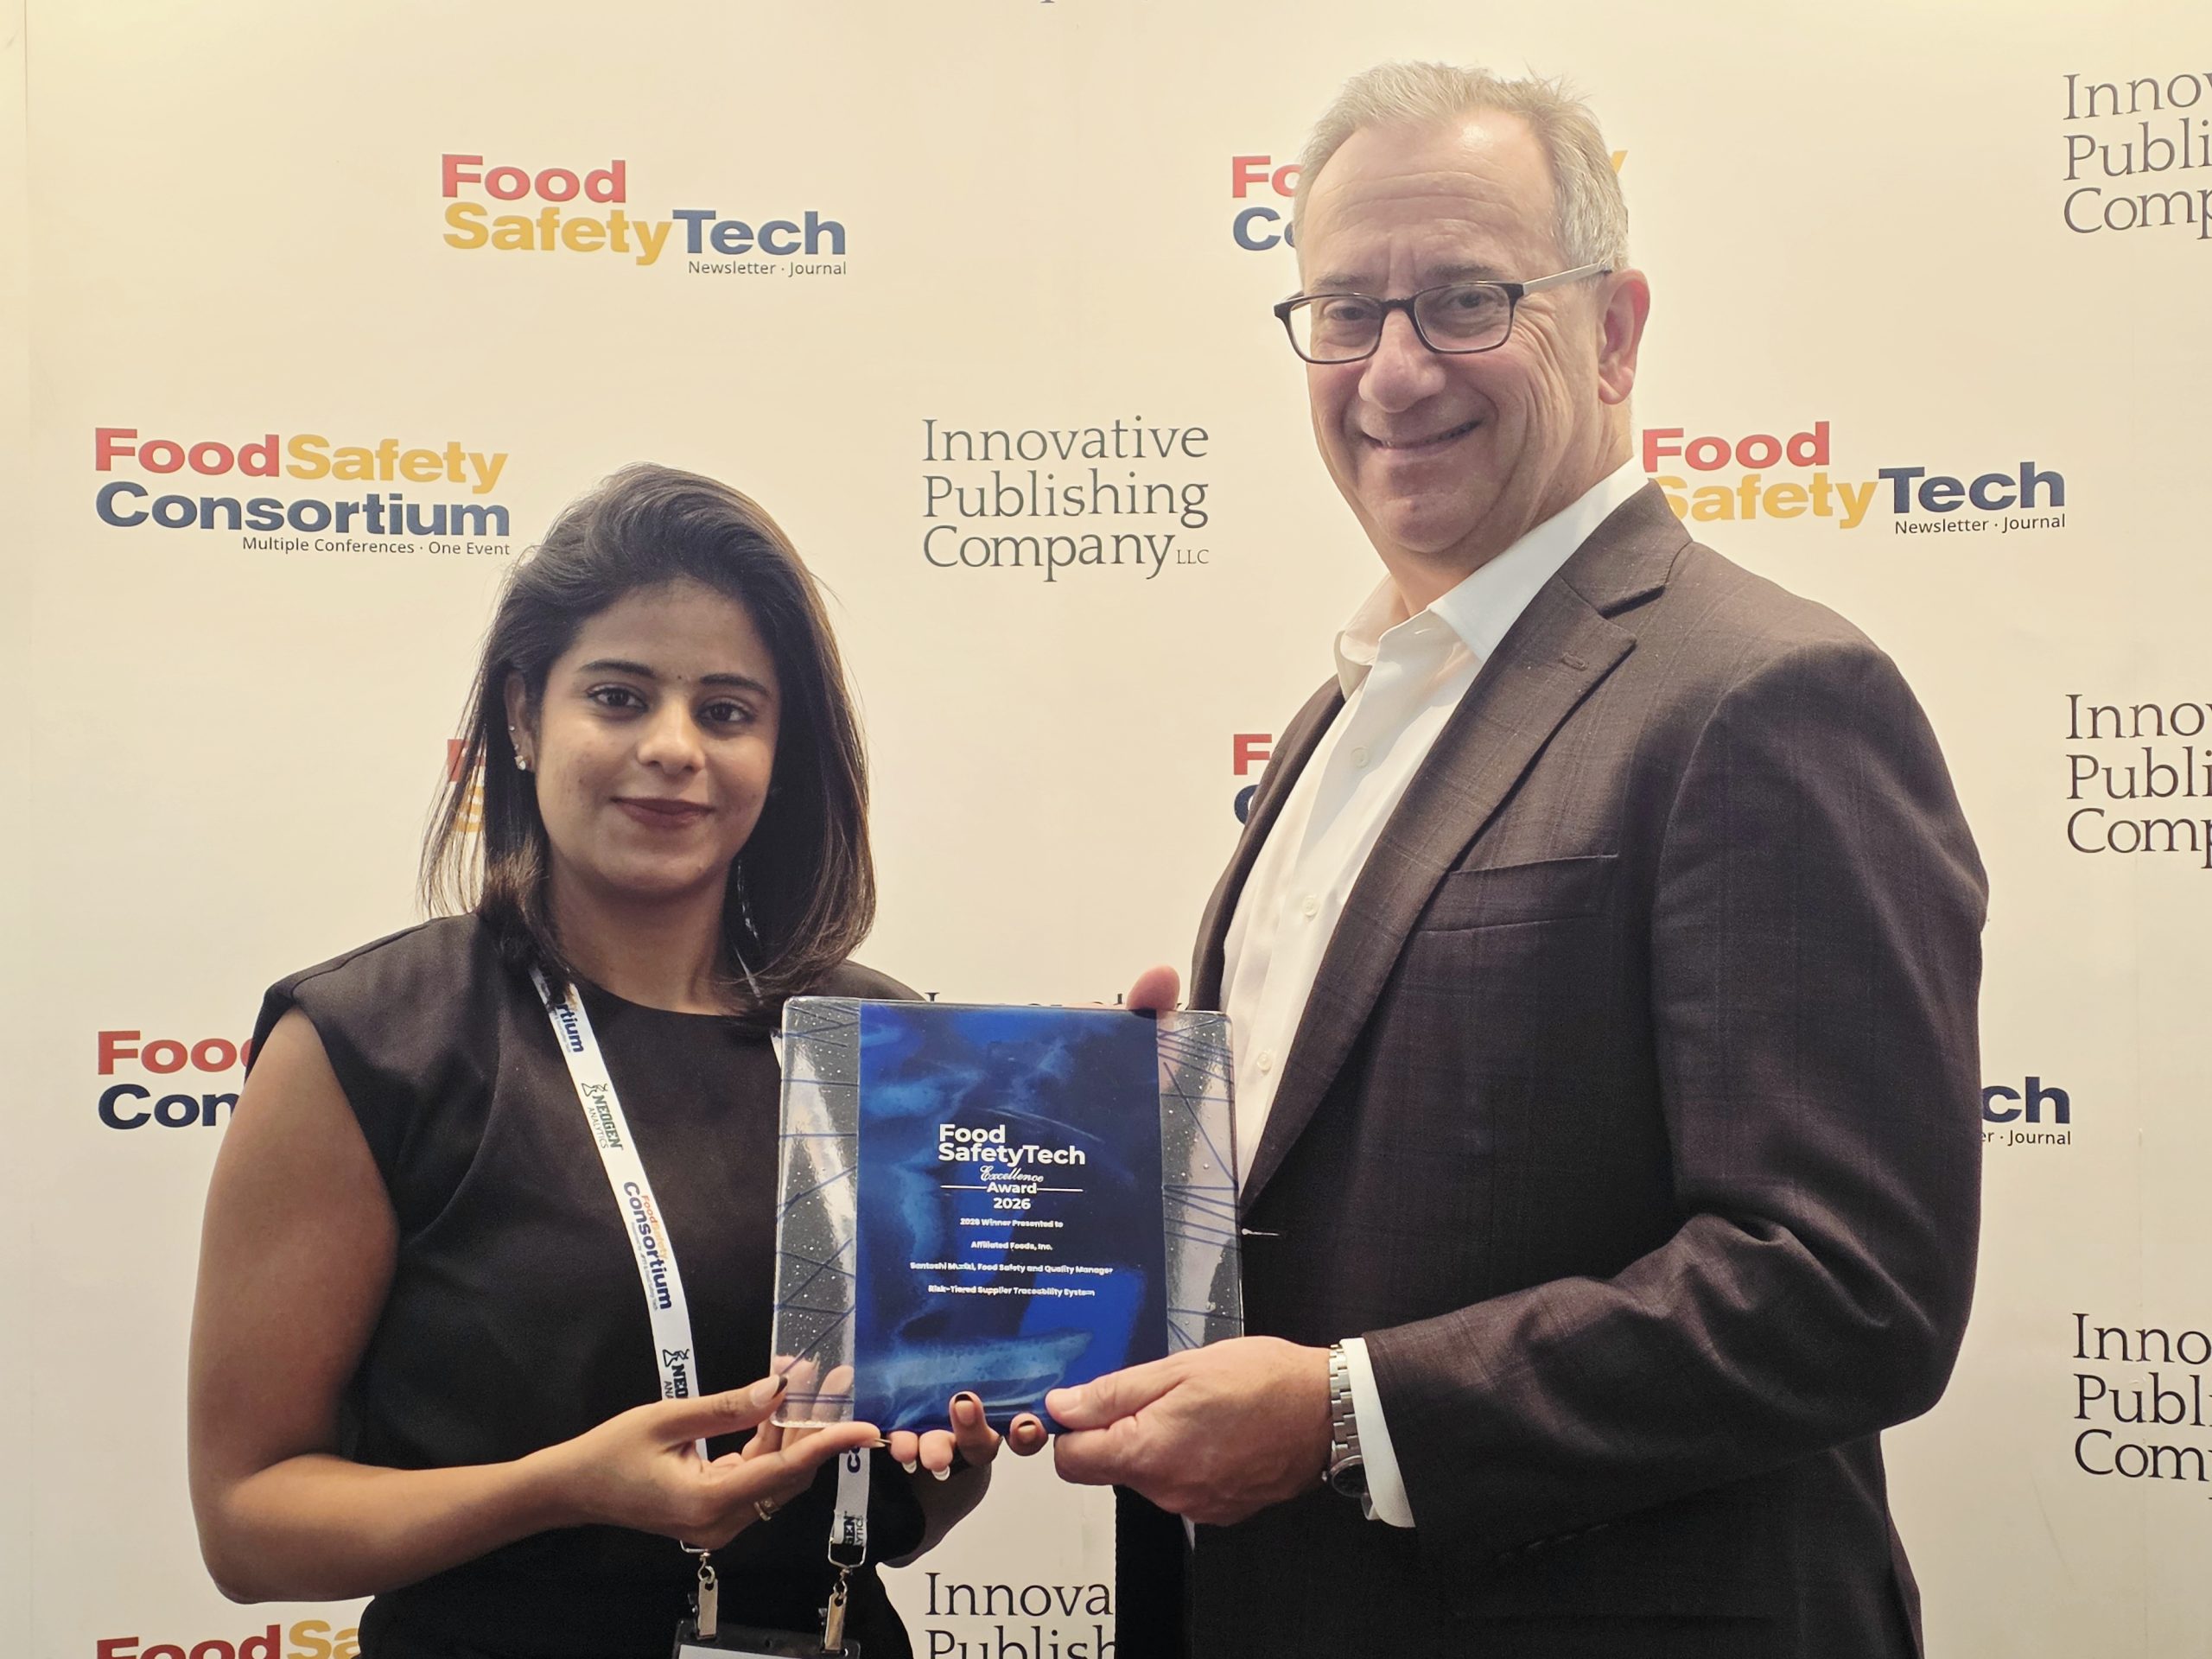
Rick Biros, Content Director and Founder of Food Safety Tech presenting the Food Safety Tech Excellence Award to Santoshi Muriki, Food Safety Manager at Affiliated Foods

A Different Approach to a Familiar Problem

At Affiliated Foods, a wholesale grocery cooperative with more than 1,000 suppliers, preparing for the Food Safety Modernization Act’s Food Traceability Rule, commonly known as FSMA 204, presented a substantial challenge.

Supplier documentation was largely managed through spreadsheets, emails, and manual follow-ups. With suppliers representing a broad range of product categories and regulatory obligations, maintaining accurate compliance records required considerable time and attention.

Muriki recognized that treating every supplier and product the same way wasn’t necessarily making the process safer or more efficient.

Using the ReposiTrak platform, she designed, developed, and implemented a system that combines Affiliated Foods’ existing three-tier supplier risk structure with a new product-level classification framework.

Her Kill-Step Category A/B approach considers whether products have undergone validated processing steps, such as pasteurization or retort processing, that affect applicable food safety and traceability requirements.

This distinction allows the company to evaluate supplier reliability separately from product-level risk, helping ensure that compliance resources are directed where they are most needed.

Rather than simply digitizing an existing process, Muriki redesigned how supplier compliance was evaluated and managed.

Less Chasing Paperwork. More Managing Risk.

The results reported in Muriki’s award submission speak to the value of that approach.

  • 60% reduction in manual follow-up required to track and verify supplier documentation.
  • 50% faster supplier onboarding into the compliance system.
  • 100% critical-document compliance achieved across the tracked supplier base.

The system automatically identifies missing or expiring documents, supports supplier onboarding, and provides food safety, procurement, and vendor management teams with greater visibility into compliance status.

It also includes re-verification triggers associated with recalls, nonconformances, and audit findings, helping ensure that documentation receives renewed attention when circumstances change.

For food safety professionals, these improvements mean less time pursuing paperwork and more time evaluating supplier performance, addressing potential gaps, and maintaining oversight.

The result is a shift from reactive documentation management toward a more proactive approach to supplier compliance.

David Hatch, Co-Founder and Chief Research Officer of Food Safety Tech Research (FSTR), highlighted the connection between food safety outcomes and measurable business value during the award presentation.

“We’ve talked a lot about the combination of achieving food safety outcomes, public health outcomes, and combining that with the business benefit, the return on investment of investments that you make in technology and in data, and this submission really stood out for those reasons. Things like that really get the attention of senior leadership, especially achieving 100% compliance with the FSMA 204 standard well ahead of schedule. It really got our attention, and so congratulations.”

The Initiative Behind the Innovation

What makes Muriki’s achievement particularly noteworthy is the level of personal responsibility she assumed.

According to her award submission, she independently identified the need for a more sustainable compliance system, designed the framework, and led its implementation across the supplier network.

She served as the project’s sole architect, taking it from concept through rollout.

Tracy Fink, Founder and Principal Advisor of ThinkFink Solutions, LLC, also recognized the effort required to implement a system of this scale.

“I wanted to recognize not only the discipline, the persistence, and the collaboration that this took. The complexity of 1,000 plus supplier networks into a practical, proactive, practical, proactive system is a phenomenal achievement, and so such a well-deserved recognition.” Fink told Muriki. 

That initiative reflects a professional philosophy evident throughout Muriki’s career. Food safety programs should do more than satisfy an audit requirement. They should help organizations make informed decisions, identify potential risks, and improve everyday operations.

Muriki brings more than seven years of food safety and quality assurance experience spanning manufacturing and wholesale grocery distribution.

Her background includes HACCP program management, environmental monitoring, supplier verification, internal auditing, food safety certification systems, and recall and reclamation processes.

She holds a master’s degree in Food Science and Nutrition from the University of Central Oklahoma and a bachelor’s degree in Food Science. Her professional training and credentials cover recognized food safety standards and disciplines, including SQF, FSSC 22000, ISO 22000, preventive controls, and HACCP.

Beyond her operational responsibilities, Muriki contributes to industry discussions through technical reviewing and writing on traceability, supplier compliance, recall readiness, and food safety governance.

Her interest in advancing food safety also extends to research. The methodology underlying her award-winning project was developed into a manuscript titled Risk-Tiered Supplier Compliance Model, which, according to her submission, was accepted for publication in Food Protection Trends following scientific peer review.

Why Her Work Matters Beyond Affiliated Foods

The challenges Muriki addressed are familiar throughout the food industry.

Manufacturers, distributors, retailers, and foodservice organizations must balance regulatory requirements, supplier accountability, operational efficiency, and the need to respond quickly when something goes wrong.

Her work offers an example of how thoughtful system design and existing technology can improve that balance.

It also raises an important question for food safety leaders. How much time are their teams spending collecting information versus using that information to make better decisions?

Muriki’s project demonstrates that improvements in compliance efficiency do not have to come at the expense of oversight. When designed appropriately, automation can support both.

The approach also has potential applications beyond one company. Although each organization has its own supplier network and regulatory obligations, the underlying principles of risk-based classification, consistent documentation, and continuous monitoring are broadly relevant.

Recognizing a Commitment to Food Safety

The Food Safety Tech Excellence Award was established to recognize innovative technical solutions that produce measurable improvements in food safety operations.

Submissions were evaluated by the Food Safety Tech Advisory Board based on innovation, scalability, measurable improvement, and sustainability.

Affiliated Foods’ achievement reflects those priorities, but it also represents something less easily measured.

It demonstrates the value of professional initiative.

Muriki recognized an operational challenge, developed a practical solution, and followed through with implementation. The improvements reported in her submission show what can happen when technical knowledge is paired with the determination to make existing processes work better.

Food safety innovation doesn’t always require inventing a new technology. Sometimes it means questioning a familiar process, recognizing its limitations, and finding a more effective way forward.

As the inaugural recipient of the Food Safety Tech Excellence Award, Affiliated Foods represents the kind of dedication, resourcefulness, and practical problem-solving that continues to move the food safety profession forward.

And for professionals still spending too much of their day chasing supplier documentation, her accomplishment offers an encouraging thought.

There may be a better way to get the job done.

When the cooler is compromised: what food safety teams cannot see during a refrigeration cyberattack

By Amir Samoiloff
No Comments

There is one number that should keep a food safety manager awake at night: 30 percent. It is the share of the incident response cases one security firm handled in 2025 that began as unexplained operational issues rather than security alerts. In the exercises the same firm ran with asset owners, 82 percent had no clear criteria for deciding when an operational anomaly should trigger a cybersecurity investigation. Part of that gap is readiness, but a larger part is that a warming cabinet and a manipulated defrost schedule look identical at the start, and telling them apart is extremely difficult without evidence from the equipment itself. The refrigeration attacks of the past month began in exactly that way.

Two attacks with different stakes

On 11 October attackers forced defrost cycles in supermarkets across France, with as many as 700 stores affected and cold-room temperatures reportedly reaching 50°C. Le Monde reported that some freezers had been set to defrost for up to eight hours, which also postponed the alarms. The attacks went on to affect retailers in several countries, including the UK, by 3 November, according to The Guardian.

The attack of 2 November was a different kind of target. Three cold stores run by contractors of the French blood service had their temperature and defrost thresholds raised to “very high levels”, with readings as high as 110°C reported by Le Canard enchaîné. The blood service is government critical infrastructure even when contractors manage the plant, and the plasma in those stores is a national medical supply, so a loss there is a public health matter and not only a commercial one. No motive is known, no one has claimed responsibility and the way in has not been disclosed.

The CERT-FR alert, which now covers Copeland and Dixell controllers as well as Danfoss, advises removing internet exposure, restricting access to a VPN and checking defrost schedules. That is sound advice for prevention and clean-up, but it says little about the hours in between, when a breach has already succeeded, the process is changing and nobody yet knows whether the cause is a fault or an attack.

Why the process hides the attack

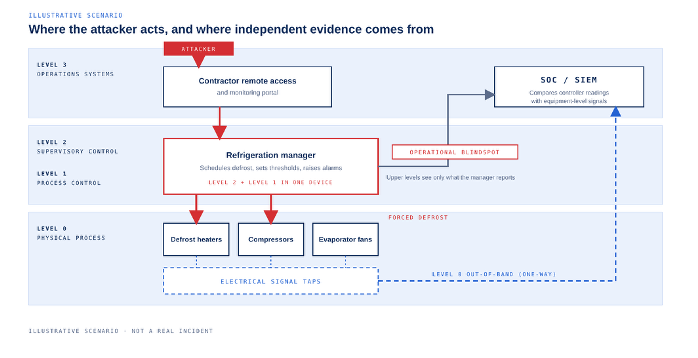
A refrigeration manager in a supermarket or cold store typically combines two roles that industrial models keep apart: it controls the equipment (Purdue Level 1) and it supervises it (Level 2), scheduling defrost, setting temperature thresholds and raising alarms. It is networked so that settings can be changed without a site visit. A command to start or lengthen a defrost, to raise a threshold or to postpone an alarm is something the system is designed to accept, so nothing in the network traffic marks it as hostile, and no malware has to be present for the process to be changed.

Figure 1. In a store the refrigeration manager combines supervisory and process control, so the upper levels see only what it reports, while electrical signal taps at Level 0 send current readings out-of-band, over a one-way path, to a SOC / SIEM. Illustrative scenario, not a real incident.

The physical symptom is the first evidence, and it does not have to be dramatic. In one French store it was a delivery driver in Gradignan who found the stockroom flooded at about 4am after the alarms had been postponed. In other cases there may be no wet floor at all, only a cabinet drifting inside its tolerance while the screen reports normal. Once an attack reaches the process level it has many ways to mask what is happening until the damage is done, and researchers showed at DEF CON in August that readings from a compromised controller can be falsified, although there is no direct evidence that this happened in these attacks. In most cases the damage can still be stopped if the deviation is detected on time and understood in context.

Network detection tools struggle with this kind of attack for a simple reason: skilled attackers, who are expected to be increasingly assisted by AI, can use legitimate commands through legitimate channels and give those tools nothing unusual to see. It is reasonable to assume that an organization as important as the blood service had network security tools in place, although no report says so, and yet the settings of its cold stores were still changed.

Reading the process itself

Process Oriented OT Cybersecurity answers this by observing the physical process directly, at Level 0, instead of relying on what the controller says about it. Electrical signal taps on the defrost heaters, compressors and evaporator fans passively read the current each one draws, and those readings travel over a one-way path, outside the refrigeration network, to a security operations center. Because the path is out-of-band, an attacker who controls the refrigeration manager has no network path to the readings, and the equipment cannot hide the current it draws.

From those signals it is possible to build a picture of how each cabinet normally behaves: how long a defrost heater runs, how often a compressor starts, what the fans do while a defrost is in progress. A deviation is then judged in context, against the schedule, the hour, any maintenance work and the behavior of neighboring cabinets and stores. One cabinet with a long defrost is most likely a failed sensor or a stuck relay, whereas the same pattern appearing together across many cabinets, or across stores soon after a remote session, points toward something deliberate. That is the difference between detecting an anomaly and understanding it, and the second is what allows a team to act in time.

How it would look in a store

The following sequence is an illustration built from the published details and not a record of what happened in any store. A store runs twenty cabinets on one refrigeration manager, and shortly after 10pm a remote session changes the defrost settings. At 11pm a scheduled defrost should end, and the controller duly reports that it has. The tap on the heater still shows current flowing, while the compressor is idle and the evaporator fans are off, which is the electrical signature of heating without cooling. Within minutes the same signature appears on five more cabinets. The context check finds no maintenance ticket and no schedule change entered through the usual route, so the event is classified as probable manipulation and passed to the security team with the evidence attached: heater current set against the schedule and against the controller’s own report. The team can then call the store, restrict the remote access, move the cabinets to local control and send someone to check product temperatures with handheld probes, hours before a delivery driver would have had any chance of noticing.

Measures that sit around it

Detection works best as one layer among several, and Process Oriented OT Cybersecurity makes each of the others checkable. Removing internet exposure and requiring a VPN with multi-factor authentication, as CERT-FR advises, closes the obvious routes, and the electrical signals show whether a session that did get through changed anything in the plant. Setting hard limits where the equipment allows, such as a maximum defrost duration or a ceiling on temperature thresholds, constrains what a command can do, and heater current shows whether a limit is actually being enforced. Keeping an independent temperature log with its own probes and its own alarm path gives food safety records that do not pass through the controller, and the electrical signals explain why a reading changed. Separating the refrigeration network from the corporate network and making remote access read-only by default reduces the number of people who can write to the plant, and the out-of-band view confirms that the separation holds. Written criteria for when an operational anomaly becomes a security matter address the 82 percent figure directly.

After the controller is restored

Restoring the controller does not show that the plant is back to normal, because a controller can only report its own settings. Engineers still have to confirm that heaters switch on only when scheduled and that compressors restart normally. For food and for plasma, the decision to release or discard stock depends on a temperature history that does not rely on the controller, together with a record of what the equipment was doing during the hours in question, which is the record the electrical signals provide.

If the controller reported normal tomorrow morning while a cabinet felt warm, what would a food safety team have in hand to decide which stock to keep?

Amir Samoiloff is co-founder and CEO of SIGA OT Solutions.

Sources

2026 OT Cybersecurity Year in Review
OT Cybersecurity Lessons from the Frontlines
The Guardian: French blood banks hacked in latest cyber-attack on Europe
IBTimes UK: French supermarket hack, freezer defrost cycles extended to eight hours
CERT-FR alert CERTFR-2026-ALE-012
Infosecurity Magazine: Major French supermarket chains hit by cyber-attack
The Next Web: Cyberattack pushed French blood bank freezers to extreme temperatures
CBS News: Blood banks hit by cyberattack in France

“Positive ROI” Is Not a Number

By David Hatch
No Comments

Ask a food safety director whether the new system paid off, and you will hear about audit readiness, faster CAPA closure and the recall that never happened. Ask the CFO the same question, and you will get a different question back: how much? Both answers are sincere. They just aren’t the same answer. And the gap between them may be why so many food safety technology business cases die in the budget meeting.

The 2026 Food Safety Digital Maturity Benchmark surveyed 290 qualified food manufacturers on what they have deployed, what they set out to achieve and what they got back. For this article, Food Safety Tech Research (FSTR) went back into the raw responses and cross-tabulated the ROI question against everything else respondents told us. None of the cross-tabulations described in this article have been published before.

The ROI that isn’t

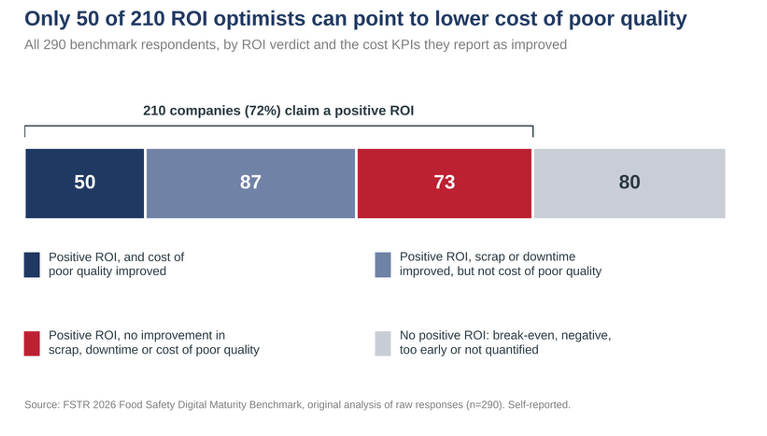
Let’s start with the good news: 72% of respondents say their digital food safety investment has produced a positive return: 30% call it strong and 42% call it moderate. The ‘moderate’ answer choice reads “benefits have somewhat exceeded costs,” and it is the single most popular answer in the survey. But that isn’t necessarily an ROI. It’s a mood.

Then there is everyone else. 80 of the 290 companies, or 28%, cannot say their technology has paid for itself. 12% call it break-even, 8% say it is too early to tell, 4% have not tried to quantify it, and 3% admit it lost money.

The more revealing number is hiding inside the optimists. Of the 210 companies that report a positive ROI, 160, or 76%, did not report an improvement in cost of poor quality. That is the one KPI on the list that is literally measured in dollars. More than a third of the optimists (35%) report no improvement in scrap, downtime or cost of poor quality at all. While the return may feel “real” from a food safety team KPI standpoint, it just doesn’t show up anywhere a controller would look for it.

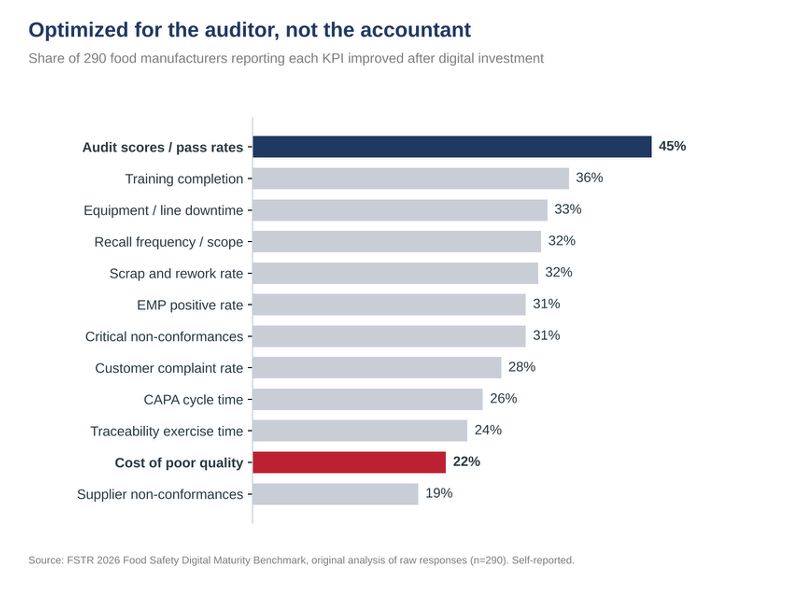
Across all 290 companies, the KPI most often reported as improved is audit scores (45%). Cost of poor quality ranks 11th of 12 (22%). The industry has optimized its technology for the auditor, not the CFO, and this is a real problem when it comes to justifying spend on new innovative tech.

And don’t think that the CFO doesn’t notice. Among companies reporting strong ROI, 82% say senior management fully supports digital investment. Among companies that call it too early to tell or haven’t quantified it, that figure falls to 17%.

Same mission, different scorecard

Food safety leaders and business leaders agree on the mission. About half of each group lists preventing contamination events as an investment objective. Where they part ways is the scorecard.

Compare the 94 respondents in food safety and quality leadership with the 42 executives and general managers who responded to the survey:

  • Budget: 52% of executives call budget a barrier to digital investment, versus 31% of food safety leaders.
  • Cost: 57% of executives set reducing scrap, waste and cost of poor quality as an objective, versus 38% of food safety leaders.
  • Compliance: 44% of food safety leaders cite regulatory compliance as a driver, versus 29% of executives. (42% set GFSI certification as an objective, versus 26%).

The executive sample is small, so treat everything except the budget gap as “directionally significant”. But the direction is hard to miss. One side is buying insurance against a bad day. The other side is reading the invoice.

Here is where it gets uncomfortable. Business framing gets business results. Companies that cite at least one business driver (reducing waste, improving uptime, cutting labor costs or competitive differentiation) were roughly twice as likely to report improvement in a hard-dollar KPI: 67% versus 34%. Companies that set a scrap or cost objective: 71% versus 51%.

One more twist, before anyone blames the food safety department. When a VP or director of food safety or quality owns the investment decision, 83% of companies report a positive ROI, versus 68% when someone else owns it. That holds even when the person answering the survey isn’t in food safety (85% versus 69%). Those companies also report full senior management support more often (72% versus 58%).

Decisions made by cross-functional steering committees fare worst: only 55% report a positive return. Food safety leadership isn’t the problem. Translating its value into the CFO’s language is.

Misery has company

If it helps, food safety, or the food and beverage industry in general is not the only function struggling to put a number on the value of its technology investments.

  • Deloitte: close to home, Deloitte’s 2025 Smart Manufacturing Survey of 600 manufacturing executives reported output gains of 10% to 20%. Yet only 42% said they were developing value targets and a measurement plan to assess progress.
  • IBM: IBM’s 2025 CEO Study surveyed 2,000 CEOs across 24 industries. They reported that only 25% of AI initiatives had delivered their expected ROI, and 64% admitted that fear of falling behind drives investment before they clearly understand the value.

Next to these cohorts, food safety looks like a star: 72% positive ROI. But notice the difference in the question. IBM asked whether initiatives met expected ROI. Deloitte asked about gains and KPIs. Our survey asked whether benefits exceeded costs and let respondents decide what counted as a benefit. Either food safety is the most ROI-efficient function in global industry, or it is grading on a curve. The cost-of-poor-quality numbers suggest the curve.

How to stop grading on a curve

None of this means food safety technology doesn’t pay. It means the industry is bad at proving that it does. The fix is less about technology than about bookkeeping.

  1. Baseline before you buy. Record the cost of poor quality, scrap, downtime and hold-and-release times before the system goes live. You can’t show an improvement against a number nobody wrote down.
  2. Translate prevention into dollars. “We avoided a recall” is a story. Your own cost of a hold, a write-off or a customer chargeback is a number. Finance will accept a conservative estimate with a source over an inspiring story without one.
  3. Retire qualified metrics from your vocabulary. Report a figure, even a range, with its assumptions in plain sight. A business case with a range invites a conversation. A business case with an adjective invites a no.
  4. Give the investment one owner who keeps two scorecards. The data favors food safety ownership over committees. But that owner needs to report the CFO’s metrics alongside the auditor’s.

The food safety function has spent decades learning to prove a negative: the outbreak that didn’t happen. That is hard, valuable work. The next step is learning to prove a positive, in dollars, to the people who sign the checks. Until then, “somewhat exceeded costs” will keep getting what it deserves: somewhat of a budget.

About the data

The 2026 Food Safety Digital Maturity Benchmark surveyed 290 qualified food and beverage manufacturers between July 22 and September 16, 2026. All benchmark figures are self-reported. The cross-tabulations in this article are original FSTR analysis of the qualified survey responses and have not been published before. Differences described as significant were tested with Fisher’s exact test at p<0.05; others are directional.

Sources

The Food Safety Digital Maturity Benchmark findings report can be downloaded from the Food Safety Tech Research (FSTR) site: https://foodsafetytech.com/research/contact-2/

Retail food safety, HACCP

Cleaning And Maintenance Protocols That Support Long-Term Food Safety

By Klaudia Klonowski
No Comments
Retail food safety, HACCP

Food safety relies heavily on the equipment used in industrial food processing. Proper cleaning and maintenance protocols that maintain standards compliance can promote long-term food safety without compromising output or efficiency. 

Food safety is a critical matter, particularly for the professionals tasked with ensuring safety during industrial food processing. The World Health Organization claims that roughly 600 million people worldwide will get sick from eating contaminated food each year, and 420,000 of them will die from food-related illness. 

Since contamination is a high risk, companies must follow certain protocols to ensure food safety and comply with government regulations. Standards like the Hazard Analysis and Critical Control Point (HACCP) management system outline principles that organizations can follow to reduce risk of contamination. With this guide, food safety professionals will understand the importance of using cleaning and maintenance protocols to promote consistent food safety. 

Understanding HACCP Protocols 

 The HACCP creates a set of rules and practices that organizations should follow if they want to reduce the risk of contamination or the spread of foodborne illness. The protocols outline certain steps, including:  

  • Conducting a hazard analysis and identifying appropriate controls for each hazard 
  • Determining critical control points in the process where hazards can be introduced or should be removed 
  • Establishing critical limits that provide measurable standards for cleaning and safety controls to maintain 
  • Establishing monitoring procedures that help the organization determine whether its industrial food processes fall within those limits 
  • Creating corrective actions to address deviations that may or may not be picked up by monitoring 
  • Outlining verification procedures to determine whether the existing system meets the full extent of HACCP standards, from within the company and by an independent expert 

 Commitment to these standards can help businesses to assess their food processing systems for hazards and risks and proactively address them. 

Food Processing Equipment’s Role in Food Safety 

Although cleaning and maintenance protocols play a heavy role in food safety, the operation and condition of the equipment itself can also affect food outcomes. A fully automated tumbling line that is designed for functionality, durability, and ease of sanitation is more likely to meet food safety standards long-term. By comparison, equipment that is poorly designed, wearing out, or made of materials that can absorb or leach toxic substances increases overall risk of food contamination. Food safety professionals must work to ensure that every aspect of the system is tailored toward food safety and purity. 

Ways to Establish HACCP-Compliant Cleaning and Maintenance 

Hygienic Design 

Hygienic design in food processing is a matter of engineering and practice. All touchpoints must be easy to sanitize quickly, manually by a food worker or with an automated system. Common principles for hygienic design include:  

  • Designating proper uses for the equipment 
  • Selecting durable materials, like stainless steel 
  • Building in effective drainage 
  • Ensuring accurate assembly 
  • Making equipment accessible for cleaning and maintenance 
  • Identifying proper sanitation processes 

For example, if the equipment is designed for clean-out-of-place (COP) protocols, it should be simple to disassemble and reassemble, without introducing damage or other hazards. 

Validated Cleaning Cycles 

Organizations are usually required to validate their cleaning cycles as part of proving their work to maintain food safety. Such standards are set by governing bodies like the U.S. Food and Drug Administration (FDA). In practice, validation looks like the governing body requiring a company to identify their cleaning cycles used in each process and establishing how those cycles remove chemical residues and other contamination hazards. 

 Such cleaning cycles depend on the type of equipment and whether it is clean-in-place (CIP) or COP. CIP equipment allows users to clean the equipment while leaving it ready for use, while COP relies on at least some disassembly for cleaning and maintenance. 

Preventive Maintenance 

Although automated systems for CIP equipment can reduce maintenance obligations, preventive maintenance is still a critical point for all industrial food processing equipment. Automated cleaning can ensure a better outcome in food safety, but routine maintenance often highlights slight deviations from standardized cleaning protocols. Preventive maintenance can help to ensure that the equipment remains functional, minimize the risk of worn components that can leach toxins into the food, and emphasize failures in food safety processes. 

Real-Time Monitoring 

Businesses could have the most detailed and accurate sanitation system possible, but they will only be able to prove it with monitoring. Monitoring is a vital component of HACCP compliance because it provides a safeguard for systems that are starting to malfunction. Real-time monitoring offers the convenience of an automated system with the accuracy of comprehensive system checks. The use of sensors can immediately alert administrators to failures within the system, such as a broken component, while collecting regular data for use in improving cleaning and maintenance protocols. 

Organizations Implementing Efficient Cleaning Protocols for Food Safety 

Many companies have updated their cleaning protocols to improve efficiency and equipment uptime, while maintaining strict adherence to food safety standards. For example, Coca-Cola Hellenic optimized its CIP protocols to maintain consistent water pressure. This change shortened the cleaning cycle without introducing additional risk. Similarly, Danone Food and Beverage Co. Ltd. keeps its production 10% below capacity in some of its production lines to provide time for CIP protocols. 

Food safety is not just a matter of regulatory compliance. Businesses that engage in industrial food processing must follow food safety protocols in order to maintain safety for the people who eat the food or work in processing. Standards like HACCP exist to help organizations determine what they need to succeed in the design and execution of a safe food processing system. By implementing modern cleaning and maintenance protocols, these companies can improve their compliance and meet their food safety goals. 

SOURCES 

https://www.who.int/news-room/fact-sheets/detail/food-safety 

https://www.fda.gov/food/guidance-regulation-food-and-dietary-supplements/hazard-analysis-critical-control-point-haccp 

‌https://www.fda.gov/food/hazard-analysis-critical-control-point-haccp/haccp-principles-application-guidelines 

https://www.solenis.com/en/resources/blog/ten-principles-of-hygienic-and-sanitary-design/ 

https://www.fda.gov/inspections-compliance-enforcement-and-criminal-investigations/inspection-guides/validation-cleaning-processes-793 

https://www.safefood.qld.gov.au/wp-content/uploads/2023/05/DFSV_CIP.pdf 

https://www.hcltech.com/blogs/optimizing-cip-cleaning-in-place-processes-in-the-food-and-beverage-industry-a-comprehensive-overview 

https://doi.org/10.1016/j.foodcont.2024.110877

Rounding Errors That Make Nutrition Facts Panels Non-Compliant, and How Small Producers Catch Them Before Print

By Waqar Anwar
No Comments

Most Nutrition Facts problems that surface in a retailer audit don’t start in the lab. The analysis or database calculation is usually sound. The error creeps in at the last step, when raw numbers are converted into the values printed on the panel.

FDA’s rounding rules in 21 CFR 101.9(c) are short, but each nutrient has its own increments, and those increments change at specific thresholds. That is where small and mid-size producers most often slip. A sodium value printed as 145 mg instead of 140 mg will not stop a product from shipping. It does tell a retailer’s label reviewer, a state inspector or FDA that the label was not built against the regulation, and it invites a closer look at everything else.

The rounding ladders in plain language

Each nutrient follows a ladder: below a floor, declare zero or “less than”; in a middle band, round to a fine increment; above a threshold, switch to a coarser one. The ladders QA teams use most:

Nutrient Declare as zero Middle band Above threshold
Calories Under 5 5–50: nearest 5 Over 50: nearest 10
Total, saturated and trans fat Under 0.5 g 0.5 g to under 5 g: nearest 0.5 g 5 g and over: nearest 1 g
Cholesterol Under 2 mg 2–5 mg: “less than 5 mg” Over 5 mg: nearest 5 mg
Sodium, potassium Under 5 mg 5–140 mg: nearest 5 mg Over 140 mg: nearest 10 mg
Total carbohydrate, fiber, total sugars, added sugars, protein Under 0.5 g (may be 0) Under 1 g: “less than 1 g” 1 g and over: nearest 1 g
%DV, macronutrients — — Nearest 1%
%DV, vitamins and minerals Under 2% (may be 0) 2–10%: nearest 2%; 10–50%: nearest 5% Over 50%: nearest 10%

FDA’s Food Labeling Guide collects these rules in a single table (Appendix H). It belongs on the desk of anyone who signs off on label artwork.

Five error patterns, with corrections

  1. The wrong increment above a threshold. A snack with 53 calories per serving is printed as 55. Above 50 calories the increment is 10, so the correct declaration is 50. Sodium of 143 mg is often printed as 145 mg; above 140 mg it rounds to the nearest 10, so 140 mg. These errors usually come from a spreadsheet that applies one rounding formula across the whole range.
  2. Decimals where the rule calls for zero or “less than.” Trans fat of 0.3 g printed as “0.3 g” should read 0 g. Cholesterol of 3 mg printed as “3 mg” should read “less than 5 mg.” Protein of 0.7 g printed as “0.7 g” should read “less than 1 g.” Decimals below the floor look precise, but the regulation provides no such format.
  3. Rounding twice. Producers round per-serving values, then multiply them to fill a per-container column, or round per-100 g data before scaling to the serving. Each step compounds the error. Take a product with 138 mg sodium per serving and three servings per container. The correct per-container figure starts from 414 mg and rounds to 410 mg. Multiplying the rounded 140 mg by three gives 420 mg, which is wrong. Every column and every scaled value should be calculated from unrounded data.
  4. %DV built on outdated Daily Values. The 2016 Nutrition Facts final rule changed several Daily Values: sodium from 2,400 to 2,300 mg, total fat from 65 to 78 g, total carbohydrate from 300 to 275 g and dietary fiber from 25 to 28 g. Templates built before the update are still in circulation. For 3 g of fiber, the current DV gives 11%; the old one gives 12%.

A related point is often misread. Under 21 CFR 101.9(d)(7)(ii), %DV may be calculated from either the declared (rounded) amount or the actual (unrounded) amount. A panel showing 0 g saturated fat beside 2% DV can therefore be correct: 0.4 g divided by the 20 g DV is 2%. The real risk is mixing methods across nutrients or SKUs. Choose one method, document it and apply it consistently, so any reviewer can reproduce every number on the panel.

  1. An incomplete added sugars declaration. The “Includes X g Added Sugars” line is mandatory and carries its own %DV, based on a 50 g Daily Value. Common gaps are a missing %DV, or a %DV calculated against total sugars. A product with 12 g of added sugars should show 24% DV on that line.

Rounding is not accuracy

Correct rounding does not make a value compliant on its own. Under 21 CFR 101.9(g), FDA compares laboratory results against the declared value. Added or fortified nutrients must be present at 100% or more of the declared amount. Naturally occurring vitamins, minerals, protein and fiber must reach at least 80%. Calories, sugars, total and saturated fat, cholesterol and sodium must not exceed 120% of the declared value. A value rounded down near a band edge leaves less headroom, so QA teams should check results that sit close to those limits.

For exporters: the same problem, different ladders

Canada’s Food and Drug Regulations set their own rounding table (in the table to section B.01.401). It looks similar to FDA’s for calories and sodium, but differs at low levels, for example in how small amounts of fat are expressed. Canada also has no added sugars line; its sugars %DV is based on total sugars, with a 100 g Daily Value.

The EU format under Regulation (EU) No 1169/2011 works per 100 g or 100 ml and declares energy in both kJ and kcal. It declares salt rather than sodium. The European Commission’s 2012 guidance on tolerances sets the rounding: for example, fat, carbohydrate, sugars, protein and fiber at 10 g or more round to the nearest 1 g, and between 0.5 g and 10 g to the nearest 0.1 g.

The most common export error is converting a finished U.S. panel by hand. Salt is sodium multiplied by 2.5, and that conversion must start from unrounded sodium, not from the value printed on the U.S. label. Each market’s panel should be rebuilt from the original data.

A pre-print checklist for QA teams

A second reviewer can work through this list in under 15 minutes per SKU, before artwork is released:

  1. Start from unrounded per-serving values, and keep them in the label file alongside the artwork.
  2. Apply each nutrient’s own ladder. Recheck any value near a threshold: 50 calories, 140 mg sodium, 5 g fat, 0.5 g and 1 g.
  3. Confirm every zero and “less than” declaration against the floor for that nutrient.
  4. Calculate per-container, dual-column and alternate-unit values from unrounded data, never from printed values.
  5. Check every Daily Value against the current table in 21 CFR 101.9, and record which %DV method you used.
  6. Confirm the added sugars line and its %DV are present and calculated against 50 g.
  7. Compare declared values with lab results for 101.9(g) headroom, especially values near the 80% and 120% limits.
  8. For export SKUs, rebuild each market’s panel from the original data under that market’s rules.

Rounding errors are cheap to prevent and expensive to find later. A short, written verification step before print is the most reliable way to keep them off the shelf.

References

  • 21 CFR 101.9, Nutrition labeling of food, paragraphs (c), (d) and (g)
  • FDA, Guidance for Industry: A Food Labeling Guide, Appendix H (Rounding the Values According to FDA Rounding Rules)
  • FDA, Food Labeling: Revision of the Nutrition and Supplement Facts Labels, final rule, 81 FR 33742 (May 27, 2016)
  • Health Canada, Food and Drug Regulations, section B.01.401 and its table
  • Regulation (EU) No 1169/2011 on the provision of food information to consumers
  • European Commission, Guidance document for competent authorities for the control of compliance of EU legislation with regard to the setting of tolerances for nutrient values declared on a label (December 2012)
Food Fraud Quick Bites

Food Fraud and the Case for Traceability

By Johnna Hepner, Jon Woody
No Comments

Food fraud isn’t new, and I don’t know that it’s actually gotten worse over the years. What’s changed is our awareness of it. At its core, food fraud is the intentional substitution, addition, tampering, or misrepresentation of a food or ingredient for economic gain. The drivers haven’t changed much: high-value ingredients, complex global supply chains with more intermediaries than most people realize, price volatility from tariffs or natural disasters, and food safety standards that vary from country to country. Put those together and food fraud is going to keep happening. The question is how well The question is how well companies understand where they’re vulnerable and what they’re doing to reduce that risk.companies understand where they’re vulnerable and what they’re doing to reduce that risk.

I spent 24 years at FDA before retiring in 2025, and this issue followed me through most of that career. I got pulled into response and traceback work on some of the most significant food fraud events involving FDA-regulated products, including the melamine-in-infant-formula crisis, the Peanut Corporation of America case, and, near the end of my time there, the lead contamination of cinnamon that made its way into applesauce pouches sold across the U.S. That last one is worth walking through in detail because it’s a case study in exactly where our current traceability infrastructure falls short, and why that matters.

From Cinnamon Sticks to Lead Chromate

The cinnamon sticks at the center of this case originated in Sri Lanka. From there they were exported to Ecuador, passing through several intermediaries along the way, likely bought and sold more than once, before one of those intermediaries ground the sticks into powder. It was during that grinding step that lead chromate was introduced into the cinnamon.

Why lead chromate specifically? Because the product was being valued primarily based on two things, color and weight, and lead chromate enhances both. It’s the same motive behind decades of similar cases: lead chromate showing up in Hungarian paprika in the 1990s, in turmeric in Bangladesh and India. The objective wasn’t to cause harm. It was to make a cheaper product look and weigh like a more valuable one and get paid accordingly.

That contaminated cinnamon was sold to a processor in Ecuador, Austrofood, that used it to produce applesauce. The finished product was imported into the U.S. by a company called WanaBana and distributed nationally. CDC identified 566 cases of elevated blood lead levels associated with consumption of the pouches, approximately 96% of them in children under six. Nearly 3 million pouches were recalled, and WanaBana filed for Chapter 7 bankruptcy protection within months.

Why This Case Sticks With Me

Of the cases I worked, the Peanut Corporation of America investigation remains the most complex traceback I was ever part of. A single contaminated peanut paste ingredient had worked its way into literally hundreds of products, and untangling that took an enormous amount of manual effort. The cinnamon case was complex in a different way. It wasn’t about how many finished products contained the ingredient. It was about how many countries, companies, and hand-offs the ingredient itself passed through before anyone in the U.S. ever saw it: a grower in Sri Lanka, an exporter, several intermediaries in Ecuador, the grinding operation that FDA had no direct relationship with and no visibility into, a finished-goods processor, an importer, and multiple national distributors. Every additional hand-off adds another place where visibility can be lost and another party a company may know very little about.

FDA didn’t stop at identifying where the contamination happened. The warning letter to Austrofood, the Ecuador-based manufacturer, lays out the part I think is the real lesson here. Austrofood had actually flagged lead as a potential hazard twice before the recall, once in a 2022 hazard analysis covering raw materials generally and again in 2023 when it specifically named the cinnamon ingredient, and both times concluded a preventive control wasn’t necessary. The justification the second time was that the supplier had no history of problems. FDA’s response was direct: given how often lead turns up in spices, and given that this product was intended for infants as young as six months, a knowledgeable person should have reached the opposite conclusion.

There’s another interesting detail buried in the warning letter. Austrofood’s own supply chain program required an annual onsite audit of its Ecuador-based suppliers, including Negasmart, the distributor that supplied the contaminated ground cinnamon. That onsite audit never happened. Austrofood substituted what the letter calls a “desk audit,” a paper review, which FDA noted wasn’t consistent with the company’s own supply-chain program. When FDA tested the cinnamon from that supplier directly, it found lead as high as 5,110 parts per million, along with extremely high chromium levels. Further analysis identified lead chromate in the cinnamon rather than incidental lead contamination. Lead chromate doesn’t turn up in cinnamon by accident.

None of that is really a traceability problem. It’s a prevention problem. Austrofood had information that should have led to stronger supplier controls before the contaminated cinnamon ever reached the applesauce. But once prevention fails, traceability determines how quickly you can figure out where a product came from, where it went, and what else may be affected.

Where FSMA 204 Doesn’t Reach

Here’s the part I think gets missed in a lot of the traceability conversation right now. There’s a lot of attention on FSMA 204, FDA’s food traceability rule, and rightly so, particularly in light of a string of high profile foodborne illness outbreaks this year. But that rule applies specifically to foods on FDA’s Food Traceability List, and a lot of the products that show up again and again in food fraud cases simply aren’t on it. Spices are a good example. Cinnamon isn’t on the list, and neither are a lot of the other high-value, high-fraud-risk commodities that keep showing up in incident after incident. If your compliance program stops at the FTL, you have no visibility into exactly the categories most likely to be defrauded.

So companies that are only building traceability programs to satisfy the letter of FSMA 204 are going to have blind spots in some of the very categories that repeatedly show up in food fraud cases. That’s not a shortcoming of FSMA 204; it wasn’t designed as a food fraud prevention rule or as a universal traceability requirement. But it does mean companies shouldn’t treat FSMA 204 compliance as the endpoint of their traceability programs. This is particularly true for ingredients like spices and honey that show up year after year in global fraud reporting but aren’t covered by the FTL.

Buying Down the Risk

There isn’t one control that’s going to prevent food fraud. What companies are really trying to do is buy down risk. The starting point is recognizing that food fraud is a business risk in the first place, separate from the microbiological and chemical safety risks most food safety programs are already built around.

That risk also changes over time. A commodity that looks relatively low-risk today may look very different after a crop failure, a sudden price increase, new tariffs, or instability in a major sourcing region. Horizon scanning can help companies see those pressures developing and ask where they may be creating new incentives for fraud.

A food fraud vulnerability assessment brings that down to the ingredients and products a company actually buys. Where does an ingredient come from? How many hands does it pass through? Does it have a history of adulteration? Is there an inexpensive way to make it look better, weigh more, or otherwise appear more valuable than it really is? From there, supplier audits and targeted testing can help address the vulnerabilities you’ve identified, although neither eliminates the risk.

Traceability plays a different role. A traceability system wouldn’t have stopped someone in Ecuador from grinding lead chromate into cinnamon to make it heavier and brighter. That’s what the preventive side of the equation is for. But when prevention fails, traceability determines how quickly you can figure out where an ingredient came from, where it went, and what else may be affected. For cinnamon and other high-value ingredients moving through complex global supply chains, that’s worth knowing even when a regulation doesn’t require you to.

The Data Has to Move

The cinnamon case raises a broader question for the food industry: How well do we really understand the journey of an ingredient before it reaches the consumer?

As ingredients move through multiple suppliers, countries, and systems, information can become fragmented. Companies may have the records they need within their own operations, but connecting that information across the supply chain is often a different challenge.

Across the food supply chain, companies already generate enormous amounts of data. The challenge isn’t necessarily a lack of information. It’s that the systems holding that information often weren’t designed to communicate with one another.

A grower may have visibility within its operation. A processor may have the records it needs within its facility. Distributors and retailers may each maintain their own information. Yet gaps can still exist between those systems and trading partners, making it difficult to piece together the complete journey of an ingredient or finished product.

At Starfish, we see this challenge across the food supply chain. Companies often have the information they need within their own operations, but connecting that information across trading partners remains difficult. The next phase of traceability isn’t simply about collecting more data or introducing another technology platform. It’s about making the information companies already generate more accessible and useful across the supply chain.

This is where interoperability becomes important. The ability for different systems to exchange and use information, without requiring everyone to operate on the same platform, can help close gaps in supply chain visibility.

Better connected data won’t prevent someone from intentionally adulterating an ingredient. But it can strengthen supply chain visibility, support investigations, and help companies identify where affected products have moved.

FSMA 204 is helping advance the industry toward more structured, accessible traceability information. But the opportunity extends beyond the foods covered by the rule.

The bigger question isn’t simply whether companies have traceability data. It’s whether they can access and share that information across their supply chains when it matters most.

Learning From the Past

The food industry has decades of experience to learn from. Investigations like the cinnamon case have exposed vulnerabilities in supplier oversight, preventive controls, and visibility across complex supply chains.

Yet many of these same challenges continue to surface. Information remains fragmented, companies struggle to see beyond their immediate suppliers, and investigators often spend valuable time piecing together records from multiple sources.

Technology alone won’t prevent food fraud. But stronger supplier verification, better-connected information, and the ability to share data across trading partners can help companies recognize vulnerabilities and respond more effectively when prevention fails.

The real opportunity is to take what we’ve learned from past incidents and put those lessons into practice. That means looking beyond regulatory requirements and asking whether our systems, processes, and supplier relationships are giving us the visibility needed to identify risks before they become another food safety crisis.


Investigation background draws on the authors’ direct experience with the FDA response, supplemented by Weed et al., “International Investigation of Lead and Chromium Contamination in Imported Apple Puree,” Journal of Environmental Health, Vol. 89, No. 1 (July/August 2026) (DOI link); FDA’s warning letter to Austrofood S.A.S., MARCS-CMS 679052, August 9, 2024; reporting by Will Fitzgibbon for The Examination, in partnership with The New York Times and El Universo; the Food Authenticity Network’s “2024 Global Food Fraud Report”;

Why Are Food Manufacturers Still Struggling to Prevent Recurring Food Safety Incidents

By Shammi Thakur
No Comments

Food safety programs can generate extensive records without necessarily producing a complete explanation of why a problem occurred. A positive environmental sample, a failed sanitation inspection, or a deviation in a critical process parameter may trigger an immediate response. However, if the investigation stops after the affected product is contained and the corrective-action report is closed, the underlying risk may remain.

The challenge is not simply to detect more problems. It is to translate the available evidence into changes that prevent similar failures from recurring.

Why Existing Preventive Controls Do Not Always Work

Food manufacturers operate under established systems for hazard analysis, sanitation, process monitoring, environmental testing, and verification. Under the U.S. Food Safety Modernization Act (FSMA) Preventive Controls for Human Food rule, applicable facilities must implement preventive controls and take corrective action when controls are not properly implemented or prove ineffective. Those actions must address the problem, reduce the likelihood of recurrence, and ensure affected food is handled appropriately.¹

Yet documented procedures cannot guarantee effective execution under every production condition. Equipment changes, maintenance activities, production pressures, inconsistent sanitation practices, and supplier variations can introduce weaknesses that existing controls do not adequately address.

Correcting a Deviation Is Not the Same as Removing Its Cause

Consider a ready-to-eat food facility that repeatedly detects Listeria monocytogenes in the same processing area. Recleaning the affected surface may be necessary, but it may not resolve contamination associated with an inaccessible equipment junction, persistent moisture, ineffective sanitation access, or movement between processing zones.

The initial correction addresses the finding. Root-cause analysis investigates why the conditions that produced the finding existed and whether similar conditions remain elsewhere.

The FDA’s guidance on strengthening food safety through root-cause analysis recommends gathering relevant records, examining possible causes, documenting conclusions, and verifying whether the resulting interventions work.²

For manufacturers, this means resisting the temptation to select the first plausible explanation. Retraining an operator, replacing a component, or revising a cleaning procedure may be appropriate, but the action should follow evidence demonstrating what contributed to the incident.

Testing Has Limits

Microbiological testing and environmental monitoring are important tools for identifying potential contamination. However, a sample provides evidence about the material and location tested, not necessarily the condition of every product lot, surface, or production shift.

The FDA’s environmental sampling guidance explains how environmental sampling helps identify harmful bacteria in food-processing environments and supports risk-based investigation.³ Sampling plans, site selection, timing, and the response to findings therefore matter as much as the number of tests performed.

A negative result after corrective action may be encouraging, but its meaning depends on the hazard, sampling design, operating conditions, and other evidence. Repeated testing without investigating earlier positive findings can create a cycle of detection and recleaning without establishing that contamination has been controlled.

What Recurring Incidents Reveal About Investigations

A particularly important example appears in the FDA’s October 2026 CORE+EP 2025 Annual Report. A historical Listeria outbreak linked to frozen supplemental shakes was investigated in 2018, 2021, and 2023 before being resolved in 2025. The outbreak involved 42 illnesses across 21 states, 41 hospitalizations, and 14 deaths. FDA sampling at the manufacturer identified three positive environmental swabs from a processing area, and whole-genome sequencing found the detected Listeria closely related to the outbreak strain. New traceback information, historical illness records, updated epidemiological evidence, and laboratory findings helped investigators connect the evidence.⁴

The report does not establish that the manufacturer ignored previous warnings or repeatedly failed to implement corrective actions. Instead, the case illustrates the difficulty of resolving an outbreak when relevant evidence is distributed across different investigations and time periods.

For manufacturers, the operational lesson is to examine how information from separate activities can be connected. A laboratory result may become more meaningful when reviewed alongside maintenance records, sanitation history, ingredient traceability, production dates, and previous findings from related locations.

Useful investigation questions include:

  • Have similar findings occurred at the same location, on the same equipment, or during particular shifts?
  • Do deviations coincide with cleaning cycles, product changeovers, maintenance work, or changes in ingredients?
  • Have previous corrective actions produced only temporary improvements?
  • Could the same risk mechanism exist on another production line or at another facility?

The purpose is not to assume that every repeated result has the same cause. It is to identify patterns that warrant investigation and test possible explanations against the available evidence.

How Manufacturers Can Strengthen Root-Cause Analysis

Effective investigations require a documented process that links immediate containment to preventive action and subsequent verification.

  1. Define the problem precisely. Establish what occurred, where it happened, when it was detected, which products may be affected, and which controls were expected to prevent it. Vague descriptions such as “sanitation failure” can conceal several distinct mechanisms.
  2. Assemble cross-functional evidence. Bring together laboratory results, environmental monitoring records, sanitation logs, production data, equipment history, employee interviews, and supplier records where relevant. Involving personnel from quality assurance, sanitation, production, maintenance, and supplier management helps reveal relationships that may be missed by a single department.
  3. Test competing explanations. Use process mapping, cause-and-effect diagrams, structured questioning, and risk assessment to examine plausible causes. Distinguish confirmed causes from hypotheses that still require evidence.
  4. Design actions around the identified mechanism. Corrective measures may involve equipment redesign, improved sanitation access, changes to process controls, supplier interventions, revised procedures, or clearer responsibilities. Retraining should be used where a demonstrated knowledge or competency gap exists, rather than as an automatic response to every deviation.
  5. Define effectiveness criteria before closing the investigation. Establish what evidence will demonstrate that the problem has been addressed. Depending on the hazard, verification may involve targeted environmental sampling, process-record reviews across several production cycles, inspection of modified equipment, or reassessment of supplier controls.
  6. Reopen the investigation when evidence warrants it. A related finding, repeated deviation, or failure to meet the agreed verification criteria should trigger reassessment. Closure should follow demonstrated effectiveness, not simply completion of the assigned tasks.²

Table 1. Translating Recurring Findings Into Preventive Action


Recurring finding Why the immediate response may be insufficient More effective investigation
Repeated environmental pathogen detection Recleaning may leave a persistent source or contamination route unresolved Examine equipment design, moisture, sanitation access, traffic patterns, and related locations
Repeated process deviations Retraining may not address equipment limitations or unrealistic procedures Review process parameters, operating conditions, competency, supervision, and workload
Recurring ingredient-related failures Retesting a new delivery does not establish that supplier controls are reliable Review supplier performance, traceability, incoming verification, and corrective-action evidence
Similar audit findings across shifts Reminders may not resolve inconsistent working conditions Compare actual practices, staffing, resources, procedure usability, and supervisory expectations


As Table 1 shows, the response should target the conditions that enable a problem rather than repeat the same immediate correction.

Food Safety Culture and Organizational Accountability

Recurring incidents cannot always be resolved through technical controls alone. Employees must understand why procedures matter, recognize conditions requiring escalation, and be able to report concerns without pressure to prioritize production targets over food safety.

A deviation may appear to be a training issue when the underlying problem is a procedure that is difficult to follow, insufficient time for sanitation, inadequate equipment access, unclear responsibility, or inconsistent management expectations.

The FDA identifies food safety culture as a core element of its New Era of Smarter Food Safety blueprint. The agency emphasizes the beliefs, attitudes, behaviors, and organizational actions that support effective food safety management.⁵

Manufacturers can translate this principle into daily operations by ensuring that:

  • Employees can report hazards and deviations without fear of retaliation.
  • Supervisors reinforce safe practices during routine production, not only before audits.
  • Procedures reflect actual operating conditions and are supported by appropriate equipment and resources.
  • Quality, production, sanitation, maintenance, and procurement teams understand their responsibilities.
  • Lessons from investigations are communicated to teams working with similar processes or hazards.

Accountability should extend beyond the quality department. Quality teams may lead an investigation, but other functions often control the conditions that allowed the incident to occur. Management must ensure that assigned actions receive the resources and authority needed for implementation.

Using Food Safety Data More Effectively

Digital records, laboratory information systems, environmental monitoring databases, and production management platforms can help organizations identify recurring patterns. Their value depends on whether the information can be compared and interpreted across functions.

For example, repeated findings may become easier to investigate when an environmental sample is linked to the relevant production schedule, cleaning record, equipment maintenance history, and previous results from nearby sampling locations.

Manufacturers should prioritize a few practical capabilities:

  • Consistent records: Use comparable incident categories, location identifiers, dates, and equipment references to make similar events easier to identify.
  • Trend analysis: Review recurrence by hazard, location, process, shift, supplier, and corrective-action type where the data supports those comparisons.
  • Escalation rules: Define when repeated or higher-risk findings require broader investigation or management review.
  • Integrated review: Bring together laboratory, sanitation, maintenance, production, and complaint information where relevant to the incident.
  • Documented verification: Record what changed, how the action was assessed, and whether the evidence supports closure.

Advanced analytics may help flag unusual patterns, but they cannot independently establish a root cause. Data quality, domain knowledge, and effective follow-up remain essential.

Testing Investment Does Not Guarantee Better Outcomes

Demand for food pathogen testing is one indicator of attention to food safety controls.  Vyansa Intelligence forecast for Saudi Arabia’s food pathogen testing sector estimates that the sector will grow from USD 61.77 million in 2025 to USD 126.37 million by 2032, representing a projected compound annual growth rate of 10.77% for 2026–2032.⁶ 

These figures describe projected industry value, not a reduction in foodborne illness or proof that testing investment has improved prevention. The distinction matters because a larger testing program can generate more information without necessarily improving the decisions made from it.

Manufacturers should assess testing by its contribution to risk control: whether results prompt appropriate investigation, whether corrective actions address the identified risks, and whether follow-up evidence demonstrates that the controls work.

Technology and testing are most effective when integrated into a broader preventive system that includes sound process design, sanitation, supplier controls, employee competence, and management oversight.

Measuring Whether Recurrence Is Declining

Audit completion rates, testing volumes, training records, and corrective-action closure times can reveal whether activities are being performed. They do not necessarily establish whether food safety risks are being reduced.

A more informative assessment also tracks repeated findings, effectiveness-verification results, overdue high-risk actions, and incidents that recur after closure. These measures should be interpreted according to the facility’s hazards and operating context; no single metric demonstrates that every risk has been controlled.

The central question is whether the organization has changed the conditions that contributed to the incident and gathered sufficient evidence to support that conclusion.

Food manufacturers cannot guarantee that every hazard will be identified before it causes harm. They can, however, make recurring failures less likely by investigating beyond the immediate symptom, connecting evidence across functions, assigning meaningful corrective actions, and verifying that those actions remain effective under routine production conditions.

An investigation is complete not when its paperwork is closed, but when the organization has established what must change, implemented the change, and assessed whether it works.

References

  1. U.S. Food and Drug Administration. “FSMA Final Rule for Preventive Controls for Human Food.” FDA, Food Safety Modernization Act. https://www.fda.gov/food/food-safety-modernization-act-fsma/fsma-final-rule-preventive-controls-human-food. Accessed October 12, 2026.
  2. U.S. Food and Drug Administration. “Strengthening Food Safety Through Root Cause Analysis.” FDA, Outbreaks of Foodborne Illness. https://www.fda.gov/food/outbreaks-foodborne-illness/strengthening-food-safety-through-root-cause-analysis. Accessed October 12, 2026.
  3. U.S. Food and Drug Administration. “Environmental Sampling.” FDA, Sampling to Protect the Food Supply. https://www.fda.gov/food/sampling-protect-food-supply/environmental-sampling. Accessed October 12, 2026.
  4. U.S. Food and Drug Administration. “CORE+EP 2025 Annual Report: Investigations of Foodborne Outbreaks and Adverse Events in FDA-Regulated Foods.” FDA, 2026. https://www.fda.gov/food/outbreaks-foodborne-illness/coreep-2025-annual-report. Accessed October 12, 2026.
  5. U.S. Food and Drug Administration. “Food Safety Culture—Core Element 4 of the New Era of Smarter Food Safety Blueprint.” FDA, New Era of Smarter Food Safety. https://www.fda.gov/food/new-era-smarter-food-safety/food-safety-culture-core-element-4-new-era-smarter-food-safety-blueprint. Accessed October 12, 2026.
  6. Vyansa Intelligence. “Saudi Arabia Food Pathogen Testing Market Insights 2032.” Industry Report, report code VI1468. https://www.vyansaintelligence.com/industry-report/saudi-arabia-food-pathogen-testing-market-size. Accessed October 12, 2026.
Food fraud, gin, ingredients, botanicals
Food Fraud Quick Bites

Resolving mismatches in botanical purchasing documents

By Dr. Chirag Patel
No Comments
Food fraud, gin, ingredients, botanicals

A botanical sample can arrive with a promising appearance and a complete-looking document pack, yet still leave a basic purchasing question unanswered: do these records describe the same material? A specification may name one plant part, the sample label another, while the certificate of analysis refers to a batch that is not available for supply. Resolving those discrepancies before purchasing requires a traceable decision process, not simply a cleaner set of PDFs.

Give each record a defined purpose

Start by separating three things that are easily treated as interchangeable. The sample is a physical item offered for a stated evaluation. The specification describes the agreed material and acceptance criteria. The batch document, including a certificate of analysis where provided, reports information associated with an identified batch. A generic specification cannot establish that a particular sample represents the lot proposed for shipment.

Create a short record linking the supplier, product reference, sample identifier, supplier batch number, receipt date and purpose of evaluation. Record whether the supplier describes the sample as a development sample, an earlier production lot or a sample from the proposed supply lot. These distinctions do not necessarily disqualify a sample, but they change what a buyer can reasonably conclude from evaluating it.

Check four fields before comparing results

First, compare the identity description, including the botanical name and plant part. A shared common name is not a sufficient reconciliation when the underlying descriptions differ. WHO guidance on herbal monographs identifies botanical naming, plant part and material state or preparation as important elements of defining the material.1 For the purchasing record, write the agreed description explicitly rather than relying on an abbreviation understood by only one party.

Second, compare the supplied form. Whole material, cut material, powder and extract are distinct descriptions. If processing, carriers or other ingredients are relevant to the proposed material, ask the supplier to identify them in the applicable records. Do not silently interpret an extract specification as covering a powder simply because both documents carry the same product name.

Third, reconcile the sample identifier with the batch identifier. They may legitimately be different codes, but there should be an explicit link explaining which sample came from which lot. A courier reference identifies a delivery; it does not, by itself, explain the source of the material inside it. Ask for the relationship rather than inventing one from similar-looking numbers.

Fourth, identify the document version. Record the specification number, revision and effective date, alongside the date and identifier of the batch document. When a newer specification exists, ask which version governed the reported assessment and which version will govern the purchase. A later date does not automatically make a document applicable to an earlier sample.

Open one discrepancy record

Keep the original files and label photographs. Record each conflicting field, its source and the question that must be answered. Assign one internal owner to coordinate purchasing and quality review. This avoids the situation in which a salesperson receives one explanation, a quality reviewer receives another and neither sees the complete exchange.

Ask specific questions: Which plant part was used in this sample? Which batch does this certificate describe? Was revision three applicable when this batch was assessed? Request a written response from the responsible supplier contact, supported by the underlying record where needed. An informal explanation can help investigation, but it should not overwrite the original evidence or substitute for an authorized correction.

Resolve the discrepancy in a controlled sequence

First, identify the decision that depends on the missing information and keep that decision on hold. A team might continue discussing packaging or delivery schedules while withholding sample acceptance or the purchase commitment. Make that boundary visible so that commercial progress is not mistaken for technical approval.

Second, establish the nature of the discrepancy. It could be a transcription error, an outdated attachment, a sample from a different batch or a substantive difference in the material offered. These possibilities require different responses. The buyer should not choose the most convenient explanation merely because production dates are approaching.

Third, obtain a controlled correction where an error is confirmed. The issuing party should identify what changed and why, with a revision or replacement reference that preserves the connection to the original. A corrected certificate should not imply that new testing occurred unless it did. Retain the superseded document and the explanation with the purchasing record.

Fourth, ask the quality reviewer whether documentary clarification is sufficient for the decision at hand. A change in material description, uncertainty about the sample’s source or an unexplained batch substitution may require a replacement sample, additional evidence or testing. Define that requirement before asking for another document, so the supplier understands the unresolved question.

Finally, record the disposition: resolved for the stated purchasing decision, rejected or still on hold. Name the reviewer, date the decision and identify any conditions that remain. Closing an email exchange is not the same as closing the discrepancy. The final record should explain why the evidence now supports the particular decision being made.

A hypothetical example with two batches and two revisions

Consider a fictional purchase of a botanical leaf powder. Sample S-17 is labelled as coming from lot L-240. The accompanying certificate names lot L-251, and the specification attached to the quotation is revision two. A later supplier email attaches revision three and describes the product only as botanical powder, omitting the plant part. None of these fictional identifiers refers to an actual supplier or transaction.

The buyer records three questions: which lot supplied S-17, whether the intended material is leaf-only, and which specification revision applies. The supplier might explain that S-17 came from an earlier evaluation lot while L-251 is the available shipment lot. That would explain the different numbers, but it would not demonstrate that the buyer’s evaluation of S-17 establishes the acceptability of L-251.

The quality reviewer would then decide what evidence is needed for the offered lot, while the supplier clarifies the description and applicable revision. The purchasing record remains conditional until those questions are resolved. This example deliberately stops short of an acceptance outcome: the missing information, sampling basis and assessment requirements determine the next step, not the neatness of the replacement paperwork.

Keep document review separate from material release

Aligned records do not establish botanical identity, purity or safety. WHO’s herbal monograph guidance describes identification and quality testing as distinct technical activities; its identification section also explains why material form affects suitable examination methods.1 Matching names and batch numbers is therefore a way to organize the evidence, not a substitute for evaluating the material itself.

Sampling deserves its own attention. WHO’s quality-control manual describes representative samples and retention of reference material within its sampling approach.2 A buyer should establish the basis on which a sample represents a lot and have qualified personnel determine appropriate sampling and testing. A favorable evaluation of an unidentified sample cannot answer that question.

These WHO publications concern herbal materials and medicines; they are technical background, not a jurisdiction-specific food compliance checklist. The proposed workflow does not replace applicable requirements, supplier qualification, risk assessment, testing or quality release. At receipt, the delivered lot and its records still need assessment under the buyer’s established procedures.

The practical goal is a purchasing file another reviewer can follow without reconstructing weeks of conversation. It should show what was offered, what was sampled, what disagreed, how the discrepancy was investigated and what remains conditional. That clarity supports a better purchasing decision while keeping the limits of the evidence visible.

References

1. World Health Organization. WHO good pharmacopoeial practices: Chapter on monographs on herbal medicines. Annex 7, WHO Technical Report Series 1010. 2018; pp. 241-248. Official WHO source. Accessed October 17, 2026.

2. World Health Organization. Quality control methods for herbal materials. Geneva: WHO; 2011. ISBN 9789241500739. Section: Sampling of materials. Official WHO source. Accessed October 17, 2026.

Ask The Expert

The People Who Carry Food Safety

By Azure Edwards, M.S.
No Comments

Food safety usually begins as a requirement: something regulators, customers, and certifiers expect before a product can be bought or sold. Responsibility for meeting their expectations is assigned inside the organization, but understanding food safety’s relationship to business decisions does not always move inside with it. This article explores what that disconnect asks of the people holding the responsibility, how it shows up at the interfaces between functions, and why it matters to profitability, risk, growth, and brand trust.

Nearly everyone in food safety has a gut-punch of a story, and we share them at networking events and conferences. It usually goes like this: a food safety decision was made outside their knowledge or control and the consequences landed in their lap, or they were pressured to go along with something they knew was not okay. Some left their jobs because of it. Some were let go. Most of the time, they were told this is just how it is and how it has always been done. But when a pattern is repeated across roles and organizations, it describes something more pervasive than any one person’s experience, and that deserves our attention.

A company’s first contact with food safety is as a condition of doing business. It must meet the requirements that allow it to produce and sell food, and those requirements establish controls, verification, documentation, and internal accountability. Inside the facility, people translate them into daily practice. The business depends on that translation, whether it recognizes the work as operating capability or treats it as something imposed from the outside.

The difficulty comes when responsibility for food safety is designated inside the organization but still treated as external to its operational priorities. When the authority, resources, and support to meet those requirements do not accompany that designation, Quality can be cast as the organization’s in-house regulator, not only carrying the responsibility for compliance but also absorbing the frustration the business feels toward rules it perceives as unnecessary and imposed on it from the outside. Compliance ends up positioned against production rather than as part of the operation’s ability to reliably meet customer expectations and produce safe food, and the people hired to hold that responsibility find themselves standing between the business and its own commitments. The familiar “food police” label captures that dynamic well. Treating Quality as the group that asks inconvenient questions, delays work, and enforces rules the business already agreed to follow separates those rules from the work and the people they are meant to protect.

The friction between compliance priorities and operational priorities is most often experienced when a decision has both food safety and business implications. Exploring reasonable paths forward is sound decision-making; however, intense organizational pressure can erode the support required to uphold standards, shifting the burden of unresolved risk onto individuals. The people entrusted with safeguarding food should never be pressured into ethical compromise.

Formal policies and programs set expectations, but the reality of an organization’s values is revealed by how it responds to issues raised under pressure. When the person who brought forward a concern is treated as an obstacle, people notice. When reported issues fail to produce meaningful action, they notice that too. Over time, they begin to weigh the value of speaking up against the personal cost. And when that cost is too high, problems remain hidden, systems weaken, and risk compounds. That is food safety culture, and it is learned by watching.

Much of this friction happens at the interfaces, the places where one part of the operation hands something to another: where Quality meets production, maintenance work triggers sanitation work, a concern has to travel up from the floor to someone who can act on it, and a sales commitment travels back down as a production and food safety demand the floor has to execute. Each function can be doing its part while responsibility, authority, information, and resources do not meet at the same point in the work. A decision made in one place can have consequences that land in another, often on people who were not part of the decision.

The people working at those interfaces see it first. Operators, sanitation, maintenance, and line supervisors know how the work is actually being done. They see when a written procedure and the realities of a shift conflict, when temporary repairs are failing, or when demand is stretching operations beyond what the system can reliably support. They can bring it forward in context, before risk or cost grows, but whether they do or not depends on what they have seen happen at that interface before.

When food safety is viewed as an expense imposed by third parties, or as a policing function, organizations lose sight of what it holds together. Many quality challenges stem from upstream decisions about equipment, scheduling, staffing, supply chain, and product design, yet their financial toll shows up in Quality’s budget. The expense view also misses the burden placed on the workforce and the risk carried by individuals. Much of what keeps the system stable lives in people: the reasoning behind specific controls, historical attempts at solutions, recurring pain points, and informal workarounds that have become standard practice. That dependence often goes unnoticed until the person whose mind it lives in leaves. When a business relies on an individual to sustain a system it hasn’t fully embraced, the value of that expertise, and its role in business continuity, only becomes clear once it’s gone.

The stories food safety professionals share describe a pattern, and a pattern gives a business reason to look more closely at the conditions it can change. Food safety as business infrastructure starts by backing the people, at every level, who carry it: asking whether those nearest the work can voice what they see, and whether that input reaches leaders empowered to act on it. Public health isn’t the only thing that depends on the answer. So do a company’s profitability, risk profile, growth trajectory, and brand reputation.

FSMA 204 Isn’t Just Your Challenge. It’s Your Supplier’s Challenge, Too.

By Kevin Donaghy
No Comments

Imagine it’s July 21, 2028. The FDA contacts your site with a traceability request related to a contamination issue. You have 24 hours to provide data on the entire journey of a product through your supply chain, including your suppliers’ entire network.

This means you will need to answer a few questions. Do you know how your suppliers store their records? Do they use the same lot-code formats as you? Can they deliver their critical tracking events (CTEs) and key data elements (KDEs) in a way that is useful to your system?

If you can’t answer this with confidence, you’re not alone. But you are not prepared.

The Mistake Everyone Is Making with FSMA 204

The Food Safety Modernization Act (FSMA) was signed into law by President Obama in 2011 and celebrates its 15th anniversary this year. Section 204, the FDA’s Food Traceability Rule, takes effect on July 20, 2028. It calls for enhanced electronic recordkeeping for specific foods as they travel through the supply chain, including leafy greens, soft cheeses, shell eggs, fresh-cut produce and seafood. If any of these move through your network, you’ll be impacted. So will all of your suppliers.

The rule was originally set to take effect on January 20, 2026, but was extended to “ensure coordination between supply chain partners in order to fully implement the final rule’s requirements,” per the FDA. It cited industry feedback and a concern that trading partners lacked readiness, which points to a very real supplier network problem.

There are two big mistakes manufacturers are making with FSMA 204. The first is assuming that because you’re FSMA-compliant, you’ll be compliant with Section 204. The second is thinking about the rule as an internal issue that can be solved with better recordkeeping.

When the FDA shows up with that traceability request, you’ll be expected to provide an electronic sortable spreadsheet with key details within 24 hours. In order for you to obtain that information quickly – and in the correct format – your suppliers and vendors will also need to be in compliance with the rules.

The 24-Hour Rule: The Creeper Threat

What you, as a quality leader, should be most concerned about isn’t whether you’re capturing the right data (that’s a no-brainer), but whether you can access data from wherever it is in the supply chain, within 24 hours.

So let’s break down what this looks like in the real world: A manufacturer has to contact a co-packer who contacts a raw material supplier who needs to find a lot code in a spreadsheet or legacy ERP system, that may not even be compatible with our system, and you have to do it in 24 hours. That’s an extremely short window.

The financial impact, meanwhile, is massive. The FDA lacks the authority to impose fines directly, but can pursue federal civil or criminal actions if noncompliance is persistent. The greater risk, however, is losing your supplier status with major retail partners – many of which are mandating compliance before enforcement.

The Dirty Little Secret: Data Fragmentation Across Your Network

The uncomfortable truth about supplier networks in food manufacturing is that they weren’t built for this level of complexity. They have evolved, supplier by supplier, system by system. Most operate as a patchwork of disconnected ERPs, spreadsheets, and paper logs. Each node in that network may be capturing traceability data, but almost none of it is shared in a way that easily connects to the next node.

This is really what FSMA 204 is getting at: not whether you’re prepared internally, but how consistently your supply chain as a data-sharing network is performing. Those who will be most challenged won’t be companies that haven’t invested in compliance (many have). It will be those who have invested in their internal operations, but have not extended that effort to their supply networks. The moment the FDA begins tracking, the weakest link in your data chain becomes your biggest liability.

Warehouse worker in protective clothing operating a pallet jack, moving stock within a large, low-temperature cold storage facility

What “Ready” Actually Looks Like

True FSMA 204 readiness requires three interconnected elements, all of which must happen simultaneously, not in sequence.

  • Full chain traceability. All CTEs in your network must be identified and associated with the corresponding KDEs, from farm to fork. Your traceability system must extend beyond your four walls to create a seamless record that connects your supplier data with your own.
  • For manufacturers, a critical factor will be to establish a community of suppliers all speaking the same data language, capable of automatically transmitting data to one another error-free.
  • A rapid recall response is a must. The 24-hour clock isn’t about meeting a deadline for paperwork, it’s a litmus test for operational efficacy. Your quality teams must be able to achieve instant traceback and traceforward without manually combing through supplier emails.

To achieve this, you’ll need a single source of truth where all documentation is readily accessible, lot codes are automatically associated, and automatic notifications are triggered the moment a potential issue arises, all before the FDA ever knocks on the door. That way you can manage proactively and maintain continuity.

The Window Is Narrowing

July 2028 may seem like a long way off, but it’s closer than you think. Interoperability across an entire supply chain takes time, and getting your organization completely aligned on new data standards and traceability is a monumental undertaking that will require significant time and effort.

Companies that don’t take action now, and instead push the problem off until next year, will find themselves in a world of hurt when 2028 rolls around and they still aren’t prepared. Plus, many major retailers are requiring early and expanded compliance, so you’ll want to make sure you’re aligned with the expectations of your customers.

The question now isn’t if you should start preparing. It’s whether you’re preparing for the right things.