
Although milk is among the most regulated food products in the nation, microbial contamination remains a long-standing pain point. Milk products can become tainted at every stage in the production process. Microbial contamination renders farmers’ yields worthless, sharply increases production facilities’ financial losses, and backs up production.
Early spoilage is likely if microorganisms such as Pseudomonas fluorescens and Streptococcus aren’t caught in time. Illnesses caused by Listeria monocytogenes, E. coli and Campylobacter will occur if timely recalls are not issued. In the event of a recall or contamination event, the brand’s reputations and relationships with manufacturers will be damaged, and affected consumers may seek legal or regulatory action. Fortunately, emerging dairy industry technologies can help prevent microbial contamination in novel ways.
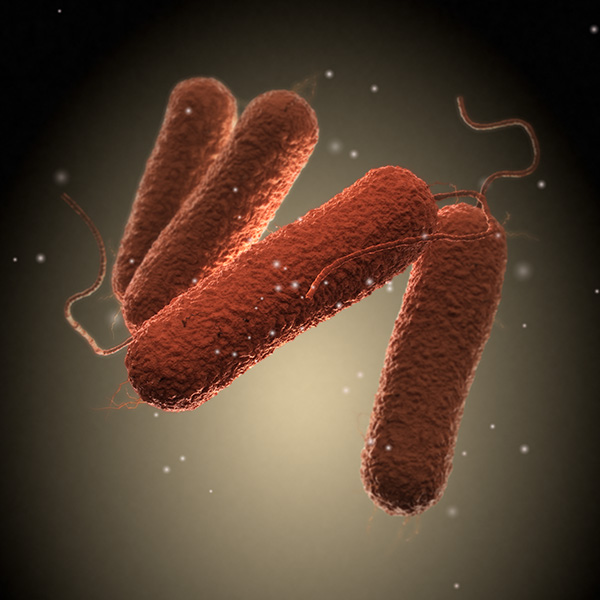
Common Microbial Contaminants in Dairy Production
Microbial contaminants take many forms in the dairy industry, as milk’s complex biology can conceal pathogenic molds, bacteria, and yeasts. Listeria monocytogenes, E. coli, Campylobacter and Pseudomonas fluorescens are some of the most common microorganisms present in dairy products.
Biofilms — microbial cells that adhere to a surface to reproduce — are a relatively overlooked source of contamination. Biofilms can persist on equipment throughout the processing chain and lead to continuous contamination, if left unchecked, highlighting the importance of proactive cleaning and maintenance.
Sources of Microbial Contamination in Dairy Production
Microbial contamination can come from dairy cattle, transport, equipment, and production staff. Virtually every stage in the process — from farmer to consumer — offers opportunities to introduce a potentially lethal contaminant.
Water used during handling and processing is one of the most prominent sources of microbial contamination. Microorganisms present in the water can contaminate food manufacturers’ equipment, tainting every product in a batch. Additionally, dairy cattle may drink from sources with high bacterial loads and produce unclean milk. Dairy cattle can consume or interact with microorganisms that cause infections and diseases. Mastitis — often caused by E. coli, Streptococcus dysgalactiae and Streptococcus uberis — is a common disease in dairy cows that can lead to production of tainted milk.
Dairy farmers who attempt to remedy dairy cattle’s ailments could cause further issues. While labs often catch and reject antibiotic-resistant bacteria, their methods are not 100% accurate. These failures highlight the need for thorough detection and treatment methods.
If milk makes it to a facility untainted, poor facility management can lead to contamination. Equipment covered in biofilm or immersed in liquids with high bacterial loads will taint the product on the production line. Poor or inadequate hygiene practices among production staff, such as wearing contaminated shoes or forgetting to wash their hands, can also lead to contamination of milk products.
Technologies That Combat Contamination
Research teams and industry experts have been working hard to develop new technologies to reduce the risk of microbial contamination. Following are some of the novel dairy industry technologies that are making products safer from farm to fork.
Ultrasonication. Ultrasonication cavitation is an emerging technology that can help to prevent microbial contamination. This noninvasive treatment method is cost-effective and environmentally safe to deploy. It can measure microorganisms in milk products, destroy microbials, reduce allergens, and improve enzyme inactivation.
Thermal Biosensors. Researchers recently developed a thermal biosensor capable of onsite microbial detection. They describe it as an easily scalable, cost-effective prescreening tool. The sensor identifies high bacterial loads including Klebsiella pneumoniae and Staphylococcus aureus. It is most effective when used in tangent with other methods and technologies.
Pulsed Electric Fields. A pulsed electric field (PEF) is a nonthermal treatment that disrupts microbial growth. It uses irreversible electroporation to target and interrupt microorganisms’ reproduction while preserving milk products’ nutritional and sensory characteristics. However, researchers note that PEF-treated dairy might have a shorter shelf life.
Cold Plasma. Cold plasma is a coating technology that inhibits biofilm formation and repels microorganisms. It can detect toxins and improve enzyme inactivation. One case involving sheep’s milk resulted in a 94.2% reduction in bacterial count. Dairy production facilities can also use it to decontaminate and sterilize equipment. Notably, it causes less degradation over time than wet chemical treatments.
Emerging Technologies Entering the Dairy Industry
In addition to the technologies mentioned above, there are two emerging technologies that may reshape how the dairy industry addresses risks of microbial contamination:
Patch-Based Biosensors. Researchers have developed a new patch-based device to prevent microbial contamination. All food manufacturers must do is place this tasteless, food-safe sticker inside their containers. An internal biosensor then detects and repels unwanted microorganisms automatically. This technology can be modified for specific pathogens.
While this technology is still in development, multiple peer-reviewed studies have highlighted its capabilities. Some variants of the patch-based biosensor can react to bacterial growth within 72 hours or less. Various research teams have created mechanical, electrochemical and bioluminescent sensors to explore this technology’s full potential.
Electron Beam Irradiation. Electron beam irradiation (EBI) is a nonthermal treatment that has numerous advantages over traditional thermal decontamination methods. It is faster, more environmentally friendly and has a lesser impact on milk products’ nutritional values.
Although EBI is new to the dairy industry, it has a long history as a food production and agriculture sterilization tool. The FDA evaluated it for three decades and deemed it safe, approving it for numerous applications. With further testing, milk products will soon follow suit.
EBI decreases contamination in raw milk samples by inactivating potentially harmful pathogenic bacteria. It reduces microbial infection risks to fewer than one out of 9.7 million people when processing at a 2 kGy dose. It leaves no chemical residues and does not alter products.
This technology has the potential to drastically reduce the microbial load in milk products while maintaining desired characteristics. Although EBI lowers the vitamin B2 content of pasteurized milk by about 32%, it remains within the USDA’s nutritional guidelines. EBI’s effectiveness increases substantially if production facilities combine it with other tools.
Most professionals understand new, advanced tools are essential. Realistically, conventional methods are quickly becoming outdated and pose significant safety gaps. Production facilities that leverage the latest dairy industry technology can prevent microbial contamination to deliver safer products to processors and consumers