Tag Archives: Focus Article

Rapid and Robust Technologies Improve Sample Preparation for Analyzing Mycotoxins

By Olga I. Shimelis
No Comments

Mycotoxins are produced as secondary metabolites by various mold species during the growth and harvest of grains, fruits, nuts and condiments. Their production is directly related to the dry/wet weather conditions during the growing season. Mycotoxins are very stable compounds and are not easily removed during storage, processing and preparation of raw agricultural commodities.

Mycotoxins & Grains
Mycotoxins can be found in a variety of grains.

Different classes of mycotoxins are distinguished on the basis of the structural similarity and originating mold species. For example, more than a dozen different aflatoxin compounds exist but only five of them are routinely tested (aflatoxins B1, B2, G1, G2, and M1). Aflatoxin B1 is of particular interest because it is listed as a Group 1 Carcinogen by the International Agency for Research on Cancer (IARC). Aflatoxin M1 is a metabolic product that can be present in milk upon ingestion of aflatoxin B1 by an animal. Aflatoxins are ubiquitous in important agricultural commodities including maize and peanuts, and are among the most studied mycotoxins.

Deoxynivalenol (DON) is produced by a different fungi species. It is prevalent in cereal crops grown under wet conditions and temperatures above 15o C (60o F). Chronic exposure of livestock to DON may result in slowed growth, impaired immune function and reduced rates of reproduction, particularly in non-ruminants.

Mycotoxins were discovered as the cause of poisoning outbreaks in both humans and farm animals in the mid-20th century. Since then, multiple government regulations were established to control the presence of these toxic compounds in food and feeds. For example, harvested grains are checked for mycotoxin contamination using rapid field screening methods prior to grain deposition into silos. If contamination is found, the crops are sent to an analytical laboratory to perform the confirmation analysis. Liquid chromatographic methods were often used for such analysis with both fluorescence and UV detection. In recent years, mass spectrometry has been employed as a detection method.

Sample Preparation for Laboratory Mycotoxin Analysis

When performing analysis, it is important to choose the right sample preparation method to ensure accuracy, sensitivity of detection, repeatability and robustness, as well as fast sample preparation for high throughput. During laboratory analysis of mycotoxins, the sample preparation procedure typically includes extraction, purification and concentration steps.

Extraction of mycotoxins from samples is conducted by mixing the ground sample with the mixture of organic solvent and water, such as acetonitrile:water (80:20). Using methanol is not recommended, because it does not provide complete extraction. Prior to cleanup, the sample is filtered. Historically, mycotoxin analysis required extensive extract cleanup to minimize interference by matrix components. This holds true as new regulations continue to require lower detection limits.

Cleanup methodologies often include the use of phase extraction (SPE). Of the different types of SPE, one of the most common is the use of immunoaffinity sorbents that result in the selective retention and cleanup of mycotoxins. The drawback to using the immunoaffinity sorbents in the lab is that they are not compatible with the mycotoxin extraction solvent. In order to load the extract into the immunoaffinity SPE tube, the extract must be diluted with water, sometimes 20-fold, to prevent precipitation or folding of the protein-based antibodies by exposure to organic solvent. This presents an additional sample preparation challenge, as the grain extracts tend to form precipitates upon the addition of water and can clog the SPE columns. Thus, apart from the high cost of immunoaffinity SPE columns, the methods tend to be labor and timeintensive.

Super Tox SPE cartridges
Super Tox is a line of SPE cartridges for mycotoxin families that eliminates extra sample prep steps.

It would be beneficial to a laboratory to eliminate these extra sample preparation steps required by immunoaffinity SPE. Such cleanup SPE procedures are available and can be applied directly to the mycotoxin extracts without the need for further dilution, filtration and evaporation. A line of SPE cartridges for different mycotoxin families was recently introduced to the market. These SPE cartridges are compatible with the extracts generated during mycotoxin extractions and can be stored at room temperature. The tubes can also be used for cleanup of multiple classes of mycotoxins.

Analysis of Aflatoxins and Zearalenone

SPE cartridges are available for aflatoxins and zearalenone.

The following results employed SPE cartridges for mycotoxins that can be used for two aflatoxin classes, aflatoxins and zearalenone, and were applied to the cleanup of grain and peanut extracts. Results were compared to cleanup using immunoaffinity columns.

AflaZea SPE cartridges are based on the “interference removal” strategy that requires fewer processing steps compared to the “bind-and-elute” strategy of the other SPE. Peanut extracts contain not only co-extracted protein and complex carbohydrates but also fat. This extract was successfully cleaned using AflaZea SPE. When the SPE tube and a leading IAC column were applied to the peanut extract, both methods demonstrated good recoveries for spiked aflatoxins B1, B2, G1, G2 with AflaZea recovery values of 101–108% and immunoaffinity recovery values of 79–100%. However, the AflaZea provided better reproducibility for detection with a relative standard deviation (RSD) of 2–4% RSD versus 10–25% RSD with immunoaffinity SPE. This is likely because sample preparation using AflaZea is less tedious and takes one tenth of the time compared to immunoaffinity SPE.

Analysis of Deoxynivalenol

Wheat samples can be analyzed for deoxynivalenol using a new SPE cartridge.

The following compares a new SPE cartridge for the analysis of DON, one of the Fusarium mycotoxins, with immunoaffinity SPE. Analysis of DON often is conducted using liquid chromatography (LC) with UV detection, so sample cleanliness is important to permit the separation of the DON peak from background interferences. The new SPE DON cartridge was compared to the immunoaffinity SPE for the cleanup and analysis of wheat samples. Clean chromatography and good recovery of spiked DON was obtained by both methods (86–97% RSD). However, clogging of the filters by the immunoaffinity SPE sample was observed during cleanup and complicated the sample preparation procedure. The SPE DON cartridge provided faster sample preparation.

Analysis of Patulin

Patulin is a mycotoxin commonly found in rotting apples.

Another SPE technology for mycotoxin analysis is based on molecularly imprinted polymers (MIPs), which are sometimes called “chemical antibodies” and mimic the performance of immunoaffinity sorbents. MIPs have binding sites that conform to the shape and functionality of specific compounds or compound classes. Strong binding of the analyte to the MIP makes it possible to perform intensive SPE washes that lead to very clean samples. Unlike immunoaffinity sorbents, MIPs are compatible with organic solvents and strong acids and bases.

Foods containing apples and similar fruits are required to be tested for patulin toxin, as they are the most common source for patulin exposure in humans. The MIP SPE procedure for patulin is faster than other SPE or liquid-liquid extraction methods and provides selective retention and superior cleanup. It is a robust method for analyzing apple juice and apple puree with HPLC-UV detection. After cleanup, patulin is quantified in apple puree at 10 ppb levels, which meet most regulatory requirements. The MIP SPE cleanup method eliminated 5-(hydroxymethyl)furfural (HMF) from the matrix, which sometimes appears as an interfering chromatographic peak when other sample prep methods are used. An SPE wash using sodium bicarbonate removed the interfering organic acids, while patulin was stabilized during elution at the end of the SPE procedure by using acidified solvent. Thus, most problems encountered during patulin analysis were resolved during this single SPE procedure.

Conclusion

As government regulations and consumer demand warrant cleaner, non-contaminated products, mycotoxin analysis will continue to be performed around the world. Careful selection of sample preparation methods is required for such analysis to achieve accurate testing results, best method performance and high laboratory throughput. Although many sample preparation methods exist, laboratories should choose the methods that not only provide adequately prepared samples, but also result in time and cost savings. The SPE technologies discussed in this article are sample preparation techniques that provide the required analytical sensitivity without capital expenditure into higher-end LC-MS equipment; the LC-UV and LC-FL methods can still be used. In addition, these SPE methods are simple, more robust, and less-time consuming compared to other SPE methods or liquid-liquid extraction.

All images courtesy of Sigma Aldrich
Food Safety Culture: Measure What You Treasure

By Lone Jespersen, Brian Bedard
1 Comment

A culture of food safety is built on a set of shared assumptions, behaviors and values that organizations and their employees embrace to produce and provide safe food. Employees must know the risks and hazards associated with their specific products, and know why managing these hazards and risks in a proactive and effective manner is important. In an organization with a strong food safety culture, individuals and peers behave in a way that represents these shared assumptions and value systems, and point out where leaders, peers, inspectors, visitors and others may fail to protect the safety of both the consumers and their organizations.

A number of factors influence these organizations, such as changing consumer demographics, emerging manufacturing hazards, and the regulatory environment. The United Nations predicts that the number of people over 60 years will double by 2035, the number of diabetes patients will increase by 35% (International Diabetes Federation), and the number of individuals living with dementia will increase by 69% (Alzheimer’s Disease International). This poses an increased urgency for food manufacturers, as these population cohorts are more susceptible to foodborne infections or may have challenges with food preparation instructions.

Much has been published on food safety culture, and we owe it to the front-runners to use their work to go deep into practical, everyday challenges and to continuously strengthen organizational and food safety culture.1 An element common to most of these publications is a reference to the importance of behaviors.2-8

There is a renewed recognition of the importance of individual behaviors specific to food safety and personal self-discipline in food processing and manufacturing organizations. Employees throughout the organization must be aware of their role and the expected food safety behaviors, and held accountable for practicing these behaviors. Embedding food safety culture in an organization can be very challenging given the need to carefully define appropriate behaviors, the difficulty in changing learned behaviors, and the complexity of objectively evaluating the level of food safety culture in a company. This article is an attempt to define useful food safety behaviors and to describe a behavior-based method that you can use to measure the maturity of your organization’s food safety culture.

Defining measurable behaviors

Behaviors is the element that, when combined with results, creates performance.9 Behaviors, if used to measure and strengthen food safety culture, must be defined carefully in a consistent, specific, and observable manner. Martin Fishbein and Icek Ajzen, authors of multiple publications on the Reasoned Action Approach, teach us how these three factors can be used to predict and explain human behavior, attitude, perceived norms and perceived control.10 They also teach us that behaviors can be defined consistently by including four elements (Figure 1).

Figure 1: Four components to a consistently defined behavior

Case: CCP operator on a baked chicken line. I work in a chicken processing company and am responsible for monitoring the internal cook temperature of chicken breasts after the product has gone through the oven. One of the important behaviors for my role could be defined as “Measure temperature of chicken after oven at predetermined time intervals”. This behavior is consistent, as it includes all four elements of the behavior definition (Table 1). The content of the behavior is defined in a way that makes it relevant for me, the CCP operator, and I am clear on the assumptions made by others on the processing line about my behavior. The behavior is observable and most people would be able to enter the processing area, observe the behavior and assess if it is performed as needed, YES or NO.

Leaving out any of the four elements of a behavior definition or becoming too general in your statements leads to poorly defined behaviors that are difficult to use as an assessment of behaviors, and ultimately as a measure of the sites for food safety culture (Table 1).

 Scenario  Behavior  Action Context Target Timing
Consistent, relevant, and observable  Measure and record temperature of three chicken pieces every hour at end of oven  Measure and record temperature  End of oven  Three chicken pieces  Every hour
Missing definition elements  Measure temperature at pre-determined intervals  Measure temperature  Not defined  Not defined  Pre-determined time intervals
Not specific  The product is cooked and checked every hour  Not defined  Not defined  The product  Every hour
Not observable  The product is cooked and check to see if it meets standard  Checked  Not defined  The product  Not defined
Table 1: Scenarios of defining behaviors

Behaviors are observable events and for this to be true, a behavior must be defined objectively in a language clear to everyone involved. It can be helpful to target a grade-six readability level, as it forces everybody writing the behavior to avoid words that are not understood in plain language.

Using behaviors to measure food safety culture

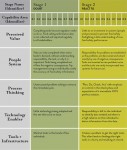
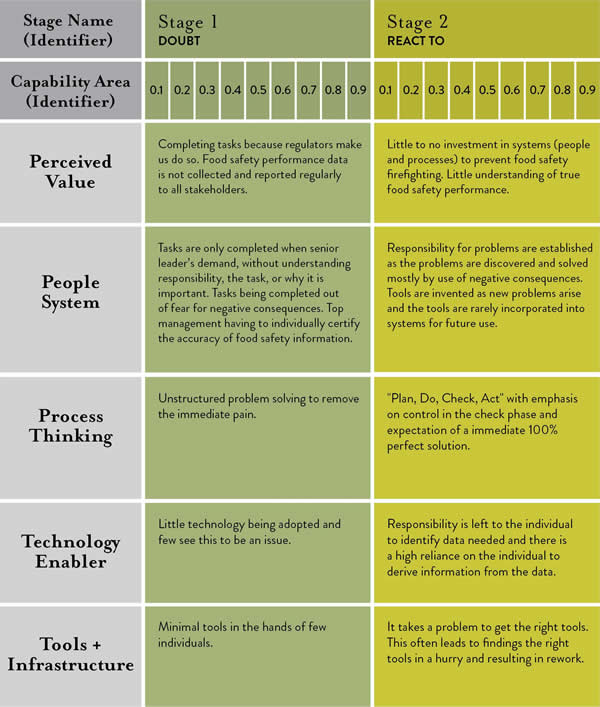
Assuming that behaviors are defined in a consistent, specific, and observable format, how do we decide the critical few behaviors that get measured? A suggested method is the use of the food safety maturity model (Table 2). The model outlines five capability areas that a processor or manufacturing company can use to measure its current state and to set priorities and direction. One capability area is Perceived Value that describes how an organization might see the value of food safety. The maturity level ranges from a low level of maturity of “Checking the box because regulators make us” to a high level of maturity for “food safety is an enabler for ongoing business growth and improvement”. Consistent, specific, and observable behaviors can be defined for each of these stages of maturity. By assessing the performance of these behaviors we can aggregate these assessment scores into a site or organization measure of the maturity of the site or organizational food safety culture. It is important to note that the maturity score does not measure “good or bad” culture. The measure is one of progression along the food safety maturity model scale, and can therefore be used to highlight areas of strength and help prioritize areas of improvement for the individual organization.


Table 2: Food Safety Maturity Model. The Food Safety Maturity Model was developed by Lone Jespersen in collaboration with Dr. John Butts, Raul Fajardo, Martha Gonzalez, Holly Mockus, Sara Mortimore, Dr. Payton Pruett, John Weisgerber, Dr. Mansel Griffiths, Dr. Tanya Maclaurin, Dr. Ben Chapman, Dr. Carol Wallace, and Deirdre Conway.

For more details on the food safety maturity model, visit www.cultivatefoodsafety.com.

Call to Action

The organization’s culture will influence how individuals throughout the group think about safety, their attitudes towards safety, their willingness to openly discuss safety concerns and share differing opinions with peers and supervisors, and, in general, the emphasis that they place on safety. However, to successfully create, strengthen, or sustain a food safety culture within an organization, the leaders must truly own it and promote it throughout the organization.8

The call-to-action for food industry leaders and regulators is to embrace a standardized measure of food safety culture to allow for comparison and sharing within an organization and between companies. “Food safety is everybody’s responsibility” was the theme of the recent GFSI Global Food Safety Conference in Kuala Lumpur, but to act on this with food safety culture as the ultimate outcome, we must adopt standardized measure. The GFSI benchmarking technical working group is an ideal forum to continue this dialogue.

During the upcoming GMA Science Forum April 12-15, 2015 join the conversation at a practical and detailed level. The preconference Food Safety Culture workshop takes place April 12, with facilitators from leading organizations;  the Food Safety Culture Signature Session on April 13 will discuss what our industry requires to enable this level of standardization and collaboration. For more information and to sign-up, visit http://www.gmaonline.org/forms/meeting/Microsite/scienceforum15.

References

  1. Schein, E. H. (2010). Organizational culture and leadership. San Francisco: Jossey-Bass.
  2. Ball, B., Wilcock, A., & Aung, M. (2009). Factors influencing workers to follow food safety management systems in meat plants in Ontario, Canada. International Journal of Environmental Health Research, 19(3), 201-218. doi:10.1080/09603120802527646.
  3. Hanacek, A. (2010). SCIENCE + CULTURE = SAFETY. National Provisioner, 224(4), 20-22,24,26,28-31.
  4. Hinsz, V. B., Nickell, G. S., & Park, E. S. (2007). The role of work habits in the motivation of food safety behaviors. Journal of Experimental Psychology: Applied, 13(2), 105-114. doi:10.1037/1076-898X.13.2.105.
  5. Nickell, G. S., & Hinsz, V. B. (2011). Having a conscientious personality helps an organizational climate of food safety predict food safety behavior. Food Supplies and Food Safety,189-198.
  6. Jespersen, L., & Huffman, R. (2014). Building food safety into the company culture: A look at maple leaf foods. Perspectives in Public Health, (May 8, 2014) doi:DOI: 10.1177/1757913914532620.
  7. Seward, S. (2012). Assessing the food safety culture of a manufacturing facility. Food Technology, 66(1), 44.
  8. Yiannas, F. (2009). In Frank Yiannas. (Ed.), Food safety culture creating a behavior-based food safety management system. New York: Springer, c2009.
  9. Braksick, L. W. (2007). Unlock behavior, unleash profits (Second ed.) McGraw-Hill.
  10. Fishbein, M., & Ajzen, I. (2009). Predicting and changing behavior: The reasoned action approach. London, GBR: Psychology Press.

Why Everyone Should Care About Food Safety

By Matt Shipman
No Comments

Food safety poses a global health problem. According to the World Health Organization, contaminated food can cause more than 200 diseases – and food- and water-borne diseases that cause diarrhea are estimated to kill two million people each year worldwide.

And food safety is not just someone else’s problem.

“Foodborne illnesses are a significant problem in the United States, with massive impacts on public health and the economy,” says Ben Chapman, a food safety expert and researcher at NC State. And the numbers back Chapman up.

According to a 2012 report from researchers at the Emerging Pathogens Institute, Resources For the Future, and the U.S. Department of Agriculture’s Economic Research Service, foodborne illness is estimated to cost the U.S. more than $14 billion annually. (The estimate takes into account factors such as medical costs and productivity losses.)

And a 2011 report from the U.S. Centers for Disease Control and Prevention (CDC) reported an estimated 9.4 million episodes of foodborne illness each year in the U.S. from known pathogens. An additional 38.4 million cases are estimated to come from unspecified or unknown pathogens. In total, foodborne illnesses are thought to contribute to 48 million illnesses annually – resulting in more than 128,000 hospitalizations and 3,000 deaths. It is, in short, a big deal.

So what are these foodborne illnesses? And how much damage does each of them cause? In advance of World Health Day, we wanted to explain a handful of the relevant pathogens implicated in foodborne illness.

Campylobacter fetus bacteria Image credit: CDC.  Obtained via Wikimedia Commons.  Click for more information.
Campylobacter fetus bacteria
Image credit: CDC.
Obtained via Wikimedia Commons.

Campylobacter

Campylobacter is a genus of bacteria, many of which can cause an illness called campylobacteriosis in humans, with symptoms including diarrhea and abdominal pain. People can contract campylobacteriosis from undercooked chicken, from cross-contamination via raw chicken, or from drinking unpasteurized milk.

According to the 2012 paper, campylobacteriosis affects 845,000 people annually in the U.S., costing the nation an estimated $1.747 billion every year and leading to 8,463 hospitalizations.

Listeria monocytogenes

This is a bacterium that causes listeriosis, which is characterized by fever, muscle aches, and sometimes by gastrointestinal problems, such as diarrhea. Listeriosis can be contracted from an incredibly broad range of foods.

According to the 2012 study, listeriosis costs the U.S. $2.577 billion annually, despite the fact that there are only 1,591 illnesses per year. But 1,455 of those illnesses require hospitalization – and 255 result in death.

Norovirus

Noroviruses are the most common cause of foodborne illness in the U.S., affecting an estimated 19-21 million people each year. Symptoms range from vomiting and diarrhea to fever and headache. Transmission comes from ingesting infected feces or vomit particles – for example, by touching a contaminated surface and then touching food or touching your mouth.

According to the 2012 study, noroviruses cost the U.S. $2 billion per year, with more than 14,000 hospitalizations and approximately 150 deaths annually. NC State is a leader in norovirus research, and home to NoroCORE – the Norovirus Collaborative for Outreach, Research, and Education. NoroCORE pulls together norovirus research from 18 institutions, with funding from the U.S. Department of Agriculture.

Salmonella enteritidis Image credit: U.S. Department of Agriculture.  Obtained via Wikimedia Commons.
Salmonella enteritidis
Image credit: U.S. Department of Agriculture.
Obtained via Wikimedia Commons.

Salmonella enterica

This is one species of the pathogen that has myriad of subspecies and types – more than 1,400 of which are known to cause human illness. Infection with Salmonella species causes salmonellosis, with symptoms including diarrhea, fever, and cramping. Salmonellosis can be contracted from a variety of sources, ranging from poultry to peanut butter to mangoes.

According to the 2012 study, the subspecies within S. enterica alone costs the U.S. $3.3 billion each year, causing more than one million hospitalizations and almost 400 deaths annually.

What are researchers doing about this?

The four pathogens listed above are just a few of the rogue’s gallery of bacteria and viruses that can cause foodborne illness. But researchers are constantly learning more about these health risks.

“New technology and new research on pathogens, practices and prevention are improving our ability to identify and address foodborne illness,” Chapman says. “The field is really opening up. It’s an exciting time to be involved in food safety research.”

Between now and April 7, we’re planning to publish a series of posts on various aspects of food safety – what we know, what we don’t know, and what we’re working on. We also hope to offer insights to help folks lower the risk of contracting foodborne illnesses. We hope you’ll learn something new.

Note: This article originally appeared on NC State News, and has been published here with permission. You can find all of NCSU’s posts related to food safety here.

Citations:

  1. Batz, Michael B., Sandra Hoffmann, and J. Glenn Morris, Jr. “Ranking the Disease Burden of 14 Pathogens in Food Sources in the United States Using Attribution Data from Outbreak Investigations and Expert Elicitation” Journal of Food Protection, Vol. 75, No. 7, 2012, Pages 1278–1291. doi:10.4315/0362-028X.JFP-11-418
  2. Scallan, Elaine, et al. “Foodborne Illness Acquired in the United States—Major Pathogens” Emerg Infect Dis, Vol. 17, No. 1, 2011. doi:10.3201/eid1701.P11101