Find records of fraud such as those discussed in this column and more in the Food Fraud Database. Image credit: Susanne Kuehne.
In a large study of nearly 6000 products, more than a quarter (27%) of herbal medicines and foods sold in 37 countries on six continents was found to be deliberately or accidentally adulterated. In this study, the products, which came in a variety of forms such as softgels, tea and more, were analyzed with high throughput DNA sequencing and showed mislabeling, added fillers, substituted ingredients or contaminants. Such fraud can be a harmful to consumer health and safety, and must be monitored and tracked closely.
Resource
Ichim, M.C. (October 24, 2019). “The DNA-Based Authentication of Commercial Herbal Products Reveals Their Globally Widespread Adulteration”. “Stejarul” Research Centre for Biological Sciences, National Institute of Research and Development for Biological Sciences, Piatra Neamt, Romania. Frontiers in Pharmacology. Retrieved from https://www.frontiersin.org/articles/10.3389/fphar.2019.01227/full.
Innovative Publishing Company, Inc., organizer of the Food Safety Consortium Conference and Expo, has announced the 2020 dates for the event. The Consortium will take place from October 21–23, 2020 at the Renaissance Convention Center in Schaumburg, IL. The event is co-located with the Cannabis Quality Conference.
Highlights from the 2019 Food Safety Consortium include:
For companies interested in reserving booth space, a super early bird sales promotion is available: $2500 per 10-foot booth before December 31. Exhibitors can reserve their booth online. For more details, contact Director of Sales RJ Palermo at RJ@innovativepublishing.net or 203-667-2212.
The food and beverage sector is a huge presence in the U.S. economy. As of 2017, the industry employed 1.46 million people across 27,000 different establishments. Total food and beverage sales stand at around $1.4 trillion and add $164 billion in value to the economy as a whole.1 This presents significant opportunities and risks alike. Companies that trade in food products are held to some of the highest regulatory standards. With globalization ongoing and a higher demand than ever for variety and niche products, companies find they need to expand the mobility of their services. They must also broaden their product choices without missing a beat when it comes to quality.
Augmented reality (AR) and virtual reality (VR) have emerged as unlikely allies in that quest. These technologies are already having a positive impact on food and worker safety in the industry.
Improves New Employee Training
Onboarding and training new employees is a costly and time-consuming endeavor in any industry. Moreover, failure by companies to impart the necessary skills, and failure by employees to retain them, can have ghastly consequences. Errors on assembly lines may result in faulty products, recalls, worker and customer injuries, and worse.
The stakes in the food and beverage sector are just as high as they are in other labor- and detail-oriented industries. VR provides an entirely new kind of training experience for employees, whether they’re working on mastering their pizza cutting technique or brewing the perfect cappuccino. Other times, “getting it right” is about much more than aesthetic appeal and immediate customer satisfaction.
Animal slaughtering and processing facilities represent some of the more extreme examples of potentially dangerous workplaces in the larger food and beverage industry. Between 2011 and 2015, this U.S. sector experienced 73 fatal workplace injuries. Excepting poultry processing, 2015 saw 9,800 recordable incidents in animal processing, or 7.2 cases for every 100 full-time employees.
Some adopters of VR-based employee training claim that virtual reality yields up to an 80% retention rate one year after an employee has been trained. This compares extremely favorably to the estimated 20% retention rate of traditional training techniques.
Training via VR headset can help companies get new hires up to speed faster in a safe, detailed and immersive environment. Food processing and service are high-turnover employment sectors. The right training technology can help workers feel better prepared and more engaged with their work, potentially reducing employee churn.
Helps Eliminate Errors in Food Processing
Augmented reality is already demonstrating great promise in manufacturing, maintenance and other sectors. For instance, an AR headset can give an assembly line worker in an automotive plant detailed, step-by-step breakdowns of their task in their peripheral vision through a digital overlay.
The same goes for food and beverage manufacturing. AR headsets can superimpose a list of inspection or processing tasks for workers to follow as they prepare food items in a manufacturing or distribution facility.
In 2018, there was an estimated 382 recalls involving food products. Augmented reality alone won’t bring that number down to zero. However, it does help reduce instances of line workers and inspectors missing critical steps in processing or packaging that might result in contamination or spoilage.
Eases the Learning Curve in Food Preparation
There are lots of food products in the culinary world that are downright dangerous if they’re not prepared properly and by following specific steps. Elderberries, various species of fish, multiple root vegetables, and even cashews and kidney beans can all induce illness and even death if the right steps aren’t taken to make them fit for consumption.
In early 2019, inspectors descended on a Michelin-starred and highly respected restaurant in Valencia, Spain. The problem? A total of 30 patrons reported falling ill after eating at El País, one of whom lost her life. Everyone reported symptoms similar to food poisoning.
The common element in each case appeared to be morel mushrooms. These are considered a luxury food item, but failure to cook them properly can result in gastric problems and worse. Augmented reality could greatly reduce the likelihood of incidents like this in the future by providing ongoing guidance and reminders to new and veteran chefs alike, without taking the bulk of their attention away from work.
Brings New Efficiencies to Warehousing and Pick-and-Pack
Consumers around the globe are getting used to ordering even highly perishable foodstuffs over the internet—and there’s no putting that genie back in the bottle. Amazon’s takeover of Whole Foods is an indicator of what’s to come: Hundreds of freezer-equipped and climate-controlled warehouses located within a stone’s throw from a majority of the American population.
Ensuring smooth operations in perishable food and beverage supply chains is a major and ongoing struggle. It’s not just a practical headache for companies—it’s something of a moral imperative, too. The World Health Organization finds that around 600 million individuals worldwide fall ill each year due to foodborne illnesses.
Augmented reality won’t completely solve this problem, but it may greatly reduce a major source of potential spoilage and contamination: Inefficiencies in picking and packing operations. Order pickers equipped with AR headsets can:
Receive visual prompts to quickly find their way to designated stow locations in refrigerated warehouses after receiving refrigerated freight.
Locate pick locations more efficiently while retrieving single items or when they already have a partial order of perishable goods picked.
In both cases, the visual cues provided by AR help employees navigate warehousing locations much more quickly and efficiently. This substantially lowers the likelihood that food products are stuck in limbo in unrefrigerated areas, potentially coming into contact with noncompliant temperatures or pathogens. The FDA recognizes mispackaged and mislabeled food products as a major public health risk.
For food and beverage companies, AR should be a welcome development and a worthy investment. FSMA recognized that 48 million Americans get sick each year from compromised foods. The act required these entities to be much more proactive in drawing up prevention plans for known sources of contamination and to be more deliberate in standardizing their processes for safety’s sake.
AR and VR Boost Food, Worker and Customer Safety
Augmented and virtual reality may seem like an unusual ally in an industry where most consumers are primarily focused on the aesthetic and sensory aspects of the experience. However, there’s a whole world that lives and dies according to the speed and attention to detail of employees and decision-makers alike. Augmented realities, and entirely new ones, point the way forward.
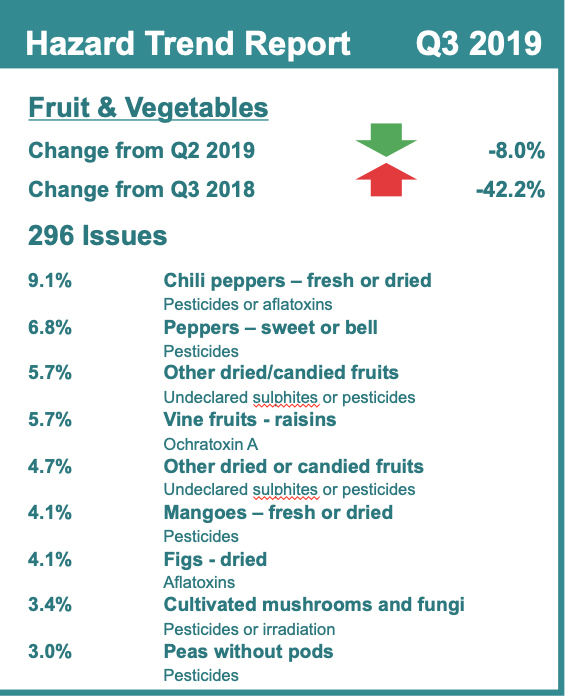
The following infographic is a snapshot of the hazard trends in fruits and vegetables from Q3 2019. The information has been pulled from the HorizonScan quarterly report, which summarizes recent global adulteration trends using data gathered from more than 120 reliable sources worldwide. Over the past and next few weeks, Food Safety Tech will provide readers with hazard trends from various food categories included in this report.
Visibility, accountability and traceability are paramount in the agriculture industry, says Allison Kopf, founder and CEO of Artemis. In a Q&A with Food Safety Tech, Kopf explains how growers can take advantage of cultivation management platforms to better arm them with the tools they need to help prevent food safety issues within their operations and maintain compliance.
Food Safety Tech: What are the key challenges and risks that growers face in managing their operations?
Allison Kopf: One of the easiest challenges for growers to overcome is how they collect and utilize data. I’ve spent my entire career in agriculture, and it’s been painful to watch operations track all of their farm data on clipboards and spreadsheets. By not digitizing processes, growers become bogged down by the process of logging information and sifting through old notebooks for usable insights—if they even choose to do that.
Allison Kopf is the founder and CEO of Artemis, a cultivation management platform serving the fruit, vegetable, floriculture, cannabis, and hemp industries. She is also is an investment partner at XFactor Ventures and serves on the boards of Cornell University’s Controlled Environment Agriculture program and Santa Clara University’s College of Arts and Sciences.
I was visiting a farm the other day and the grower pulled out a big binder. The binder contained all of his standard operating procedures and growing specifications for the varieties he’s grown over the past 20 years. Then he pulled out a pile of black notebooks. If you’ve ever worked on a farm, you’d recognize grower notebooks anywhere. They’re used to log data points such as yield, quality and notes on production. These notebooks sit in filing cabinets with the hopeful promise of becoming useful at some point in the future—to stop production from falling into the same pitfalls or to mirror successful outcomes. However, in reality, the notebooks never see the light of day again. The grower talked about the pain of this process—when he goes on vacation, no one can fill his shoes; when he retires, so does the information in his head; when auditors come in, they’ll have to duplicate work to create proper documentation; and worse, it’s impossible to determine what resources are needed proactively based on anything other than gut. Here’s the bigger issue: All of the solutions are there; they’re just filed away in notebooks sitting in the filing cabinet.
Labor is the number one expense for commercial growing operations. Unless you’re a data analyst and don’t have the full-time responsibilities of managing a complex growing operation, spreadsheets and notebooks won’t give you the details needed to figure out when and where you’re over- or under-staffing. Guessing labor needs day-to-day is horribly inefficient and expensive.
Another challenge is managing food safety and compliance. Food contamination remains a huge issue within the agriculture industry. E. coli, Listeria and other outbreaks (usually linked to leafy greens, berries and other specialty crops) happen regularly. If crops are not tracked, it can take months to follow the contamination up the chain to its source. Once identified, growers might have to destroy entire batches of crops rather than the specific culprit if they don’t have appropriate tracking methods in place. This is a time-consuming and expensive waste.
Existing solutions that growers use like ERPs are great for tracking payroll, billing, inventory, logistics, etc., but the downside is that they’re expensive, difficult to implement, and most importantly aren’t specific to the agriculture industry. The result is that growers can manage some data digitally, but not everything, and certainly not in one place. This is where a cultivation management platform (CMP) comes into play.
FST:How are technologies helping address these issues?
Kopf: More and more solutions are coming online to enable commercial growers to detect, prevent and trace food safety issues, and stay compliant with regulations. The key is making sure growers are not just tracking data but also ensuring the data becomes accessible and functional. A CMP can offer growers what ERPs and other farm management software can’t: Detailed and complete visibility of operations, labor accountability and crop traceability.
A CMP enables better product safety by keeping crop data easily traceable across the supply chain. Rather than having to destroy entire batches in the event of contamination, growers can simply trace it to the source and pinpoint the problem. A CMP greatly decreases the time it takes to log food safety data, which also helps growers’ bottom line.
CMPs also help growers manage regulatory compliance. This is true within the food industry as well as the cannabis industry. Regulations surrounding legal pesticides are changing all the time. It’s difficult keeping up with constantly shifting regulatory environment. In cannabis this is especially true. By keeping crops easily traceable, growers can seamlessly manage standard operating procedures across the operation (GAP, HACCP, SQF, FSMA, etc.) and streamline audits of all their permits, licenses, records and logs, which can be digitized and organized in one place.
FST: Where is the future headed regarding the use of technology that generates actionable data for growers? How is this changing the game in sustainability?
Kopf: Technology such as artificial intelligence and the internet of things are changing just about every industry. This is true of agriculture as well. Some of these changes are already happening: Farmers use autonomous tractors, drones to monitor crops, and AI to optimize water usage.
As the agriculture industry becomes more connected, the more growers will be able to access meaningful and actionable information. Plugging into this data will be the key for growers who want to stay profitable. These technologies will give them up-to-the-second information about the health of their crops, but will also drive their pest, labor, and risk & compliance management strategies, all of which affect food safety.
When growers optimize their operations and production for profitability, naturally they are able to optimize for sustainability as well. More gain from fewer resources. It costs its customers less money, time and hassle to run their farms and it costs the planet less of its resources.
Technology innovation, including CMPs, enable cultivation that will provide food for a growing population despite decreasing resources. Technology that works both with outdoor and greenhouse growing operations will help fight food scarcity by keeping crops growing in areas where they might not be able to grow naturally. It also keeps production efficient, driving productivity as higher yields will be necessary.
Beyond scarcity, traceability capabilities enforce food security which is arguable the largest public health concern across the agricultural supply chain. More than 3,000 people die every year due to foodborne illness. By making a safer, traceable supply chain, new technology that enables growers to leverage their data will protect human life.
Producers of food-based products are faced with challenges of maintaining the safety and quality of their products, while also managing rapid screening of raw materials and ingredients. Failure to adequately address both challenges can be costly, with estimated recall costs alone starting around $10 million, in addition to any litigation costs.1 Long-term costs can accumulate further as a result of damage to brand reputation. A vast array of methods has been employed to meet these challenges, and adoption continues to increase as technology becomes smaller, cheaper and more user friendly. One such technique is Fourier transform infrared (FTIR) spectroscopy, an analytical technique that is widely used for quick (typically 20–60 seconds per measurement) and non-destructive testing of both man-made and natural materials in food products. The uniformity and physical state of the sample (solid vs. liquid) will dictate the specifics of the hardware used to perform such analyses, and the algorithm applied to the identification task will depend, in part, on the expected variability of the ingredient.
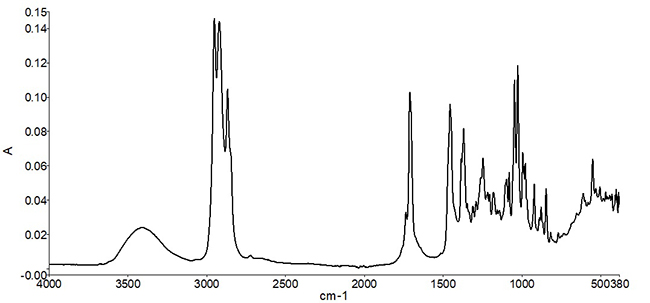
Infrared spectral measurements provide a “compositional snapshot”— capturing information related to the chemical bonds present in the material. Figure 1 shows an example of a mid-infrared spectrum of peppermint oil. Typically, the position of a peak along the x-axis (wavenumber) is indicative of the type of chemical bond, while the peak height is related either to the identity of the material, or to the concentration of the material in a mixture. In the case of peppermint oil, a complex set of spectral peaks is observed due to multiple individual naturally occurring molecular species in the oil.
Figure 1. Mid-infrared spectrum of peppermint oil. The spectrum represents a “chemical snapshot” of the oil, as different peaks are produced as a result of different chemical bonds in the oil.
Once the infrared spectrum of an ingredient is measured, it is then compared to a reference set of known good ingredients. It is important that the reference spectrum or spectra are measured with ingredients or materials that are known to be good (or pure)—otherwise the measurements will only represent lot-to-lot variation. The comparative analysis can assist lab personnel in gaining valuable information—such as whether the correct ingredient was received, whether the ingredient was adulterated or replaced for dishonest gain, or whether the product is of acceptable quality for use. The use of comparative algorithms for ingredient identification also decreases subjectivity by reducing the need for visual inspection and interpretation of the measured spectrum.
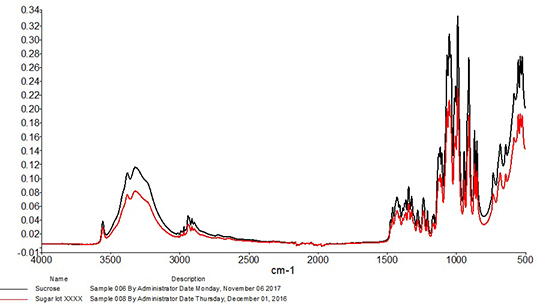
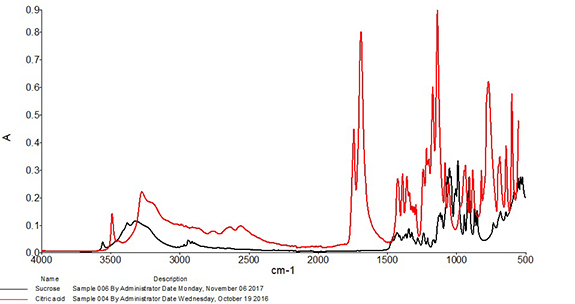
Correlation is perhaps the most widely used algorithm for material identification with infrared spectroscopy and has been utilized with infrared spectra for identification purposes at least as early as the 1970s.2 When using this approach, the correlation coefficient is calculated between the spectrum of the test sample and each spectrum of the known good set. Calculated values will range from 0, which represents absolutely no match (wrong or unexpected material), to 1, representing a perfect match. These values are typically sorted from highest to lowest, and the material is accepted or rejected based on whether the calculated correlation lies above or below an identified threshold. Due to the one-to-one nature of this comparison, it is best suited to identification of materials that have little or no expected variability. For example, Figure 2 shows an overlay of a mid-infrared spectrum of an ingredient compared to a spectrum of sucrose. The correlation calculated between the two spectra is 0.998, so the incoming ingredient is determined to be sucrose. Figure 3 shows an overlay of the same mid-infrared spectrum of sucrose with a spectrum of citric acid. Notable differences are observed between the two spectra, and a significant change in the correlation is observed, with a coefficient of 0.040 calculated between the two spectra. The citric acid sample would not pass as sucrose with the measurement and algorithm settings used in this example.
Figure 2. An overlay of the mid-infrared spectrum of sucrose and a spectrum of a different sample of sucrose.Figure 3: An overlay of the mid-infrared spectrum of sucrose and a spectrum of citric acid.
When testing samples with modest or high natural variability, acceptable materials can produce a wider range of infrared spectral features, which result in a correspondingly broad range of calculated correlation values. The spread in correlation values could be of concern as it may lead to modification of algorithm parameters or procedures to “work around” this variation. Resulting compromises can increase the potential for false positives, meaning the incorrect ingredient or adulterated material might be judged as passing. Multivariate algorithms provide a robust means for evaluating ingredient identity for samples with high natural variability.
Find records of fraud such as those discussed in this column and more in the Food Fraud Database. Image credit: Susanne Kuehne.
In the United States, the FDA is responsible for regulations and recommendations to protect public health, which includes the prevention of any type of food adulteration (unintentional contamination, intentional adulteration, and food fraud – or “economically motivated adulteration”). FSMA (the Food Safety Modernization Act) resulted in new regulations and guidance with strategies to reduce all types of risks in food facilities. It was the most comprehensive reform of FDA’s food safety regulations in more than 70 years.
Next month Food Safety Tech is hosting a complimentary virtual event, “Pathogens: Getting to the Source, Prevention Strategies that Work“, which takes on Thursday, December 5 from 1–4 pm ET. The web seminar brings together subject matter experts who will share their perspectives on pathogen contamination, smarter facility design and operational hygiene, and important prevention strategies.
Speakers include:
Larry Cohen, Principal Microbiologist, Food Safety Department, TreeHouse Foods, Inc.
David Pirrung, Owner, DCP Consulting
Dave Evanson, Technical Consultant, Merieux NutriSciences
Birds of different species can become a pest problem depending upon where they are landing, roosting or nesting. In terms of food facilities, birds can cause various concerns: Product safety risks, possible contamination (bird droppings/feathers), poor audit grades, inspection failure, secondary insect pest problems, vectoring of foodborne illness pathogens, plant closures or fines. It is for these reasons that it is essential that food, beverage and product manufacturers (FBP) establish an integrated bird management (IBM) program.
An IBM program will ensure that every essential team member is on the same page in terms of the protocols for managing pest birds within and around the facility. Even if a facility has taken a proactive approach to bird control, the potential exists for birds to enter a facility. Especially considering bird pressures around adjacent properties, buildings, bodies of water and food sources near the facility.
Read Part I of this series: Bird Problems and Control Methods for Food Production FacilitiesIBM for food industry facilities is a systematic approach to preventing birds from gaining access within a facility and reducing the length of time birds remain within a facility. Nuisance birds, depending upon how severe the bird pressure—i.e., how many birds are landing, roosting and/or nesting within a given area—can cause severe damage to equipment, property, food products, displays, vegetation, façade signage, ledges, roofs, HVAC equipment, drains, fire suppression, electrical equipment and more. The longer that birds are permitted to remain within and around a facility, the more damage they can cause, and the harder it is to remedy the problem. Thus, it is critical to remove any birds that have gained entry as soon as possible to prevent possible FBP contamination and the birds getting comfortable within the facility.
There are several components to developing an IBM program. First, you need to conduct a complete inspection of the interior/exterior of the facility, followed by a review of the current data as well as any historical bird data. Now that you have all the raw data, you can begin developing the site-specific IBM plan for the FBP facility. Now that you have the program designed, the program can be implemented. Finally, after a defined timeframe that the IBM program has been active, the program needs to be evaluated to determine if any adjustments need to be made to the program.
Inspection
The first step in developing an IBM program is to conduct an initial site inspection audit of the interior and exterior of the facility.
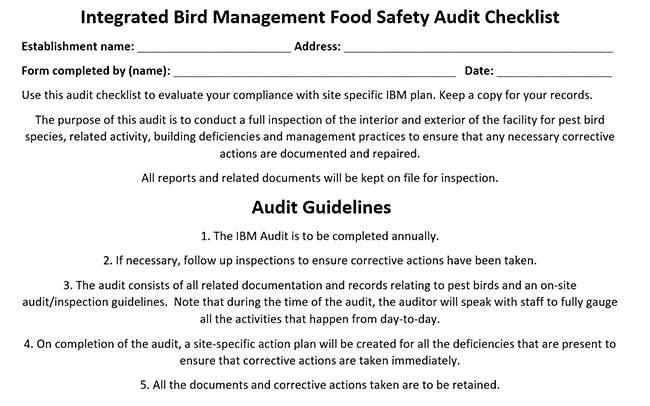
An example of an integrated bird management food safety audit checklist. Credit: Aviaway
The following various elements need to be inspected and with said findings documented.
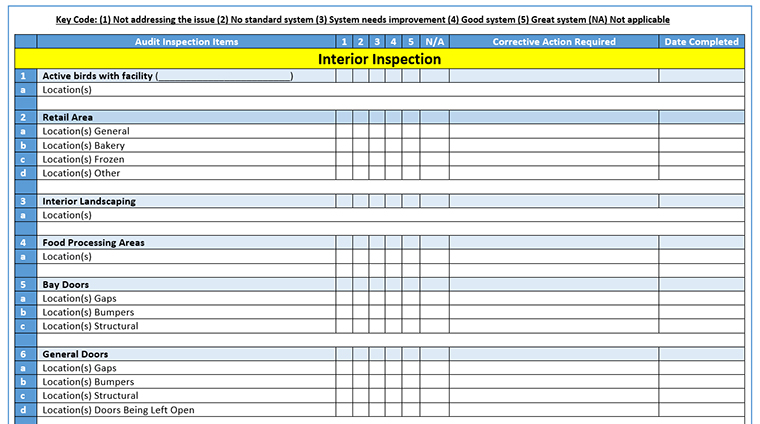
An example of an interior audit spreadsheet. Source: Aviaway. (Click to enlarge)
On the interior of the facility, look at the following items:
Active Birds with the Facility
List the areas and locations of birds
Example: Location(s): Food prep area(s), warehouse, etc.
Any history of birds and related areas
Interior Landscaping
Type(s) and necessity
Food Processing Areas
Any active control measures in place
Assess the level of risk
Bay Doors
Location(s): Gaps
Location(s): Bumpers
General Doors
Location(s): Gaps
Location(s): Bumpers
Location(s): Structural
Location(s): Doors left open
Additional Access Point(s)
Check all equipment areas that enter/exit building
Pipe-Line Penetrations
Sanitation
Conductive Conditions
Location(s): Standing water
Location(s): Food Sources
Debris
Bird Droppings or Nesting Materials
Staff feeding birds
All access to food and water
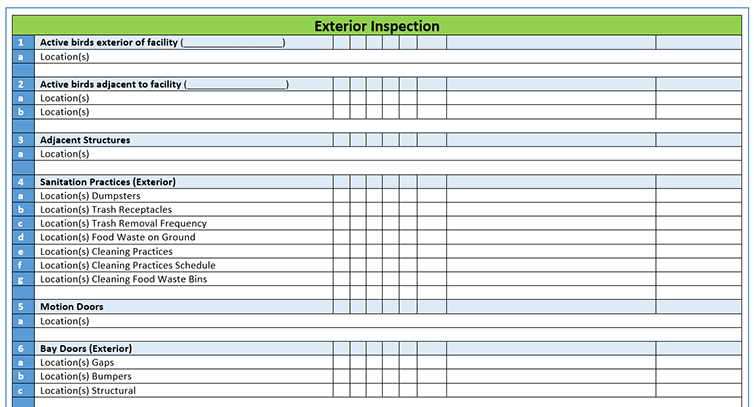
An example of an exterior audit spreadsheet. Source: Aviaway. (Click to enlarge)
On the exterior of the facility, look at the following items:
Active birds with the facility
List the areas and locations of birds
Example: Locations(s): Rear loading dock
Any history of birds around the exterior of the facility
Adjacent Structures
Accessory buildings and structures
Sanitation Practices (Exterior)
Location(s): Dumpsters
Exposed food sources and spillage
Trash Receptacles
Trash Removal Frequency
Food Waste on Ground
Cleaning Practices
Cleaning Practices Schedule
Cleaning Food Waste Bins
Motion Doors
Bay Doors (Exterior)
Location(s): Gaps
Location(s): Bumpers
Location(s): Structural
General Doors (Exterior)
Location(s) Doors Being Left Open
Additional Access Point(s)
Bodies of Water
Conductive Conditions
Structural (Exterior)
Location(s): Pipe-Line Penetrations
Location(s): Flashing
Location(s): Pipes
Location(s): Openings
Location(s): Roof
Location(s): Roof Hatches
Location(s): Windows
Location(s): Canopy (Front/Rear)
Location(s): Awnings (Front/Rear)
Location(s): Façade Signage (Front/Rear/Side)
Drainage
Standing Water
Clogged Drains
Landscaping
Retention ponds
Bird Droppings or Nesting Materials
Exterior Storage
Merchandise Displays
Existing Bird Control Devices
Review
Next, after all the above items have been inspected and findings recorded, all the data needs to be reviewed. In addtion, all the current bird management practices within the facility, documentation practices, and current audit/inspection findings should be all evaluated together. All this information is your road map for developing your IBM Program. Make sure that while you are collecting all the said raw data, you also speak with all necessary staff to get the most accurate information possible.
Documentation
Now that you have conducted your inspections and collected all the data, it’s time to create a site-specific IBM Policy & Plan for the facility. The development and implementation of the IBM plan will provide the appropriate procedures that are to be implemented to prevent, control and exclude birds from entering a facility and from keeping birds an acceptable distance away from the facility. With proper training and implementation of IBM procedures, there will be a reduced likelihood that birds will be able to enter the facility, and the length of time birds remain inside the facility will be reduced—thus, reducing the level of pest bird damage caused, reducing hazards to food sources, equipment, the public, and the facility environment.
Each facility is unique in its operation, location and potential for bird activity. The facility’s IBM plan will be designed to factor its control options when remedying and preventing bird pressure.
Implementation
Now that you have an IBM Plan, it’s time to implement the plan. First, make any necessary changes based upon findings of the audit and review of all data. Next, correct any conducive conditions that were discovered during the inspection. All the items that may require adjustment may need to be planned out depending upon budgetary constraints. Define staff roles regarding bird control efforts on a front-line facility level. Each member of the action team must fully understand their role and responsibility about the implementation and day-to-day operation of the plan.
The IBM Plan is the roadmap that should be followed for managing pest birds throughout the interior and exterior of the facility and related structures. It will set forth the facility’s bird threshold levels and site-specific facility needs. Furthermore, the IBM Plan will provide in detail how each phase of the plan will be implemented at each facility. The facility coordinator, in collaboration with the IBM coordinator, shall be responsible for the administration and implementation of the IBM plan. Each of their roles and responsibly should be thoroughly reviewed and understood.
Next, conduct staff training on proper bird control removal methods if handing live removal internally. Otherwise, what are the approved processes for third-party vendors who are providing removal services? Finally, conduct a review of the new documentation process to record all necessary data for the IBM program. Data collection is a critical component in evaluating the success of the plan and determining if any adjustments need to be made.
Evaluation
To ensure goal compliance, the IBM program should be evaluated at each site annually. The review must consist of all records, the number of birds that gained access into the store, corrective actions taken (at the facility level and outside efforts), and any plan adjustments. By reviewing all the data collected, the plan’s effectiveness can be determined, and whether alterations need to be made. Note that the IBM plan is not a static document that sits in a binder. The plan will have to evolve as operations change, or the set goals of the program are not met.
Conclusion
A proactive approach to reducing bird populations is critical for food industry facilities. As such, the IBM program will ensure that your entire staff is adequately trained on all the site-specific bird control methods, reduce the frequency of birds entering the facility and create a documented bird control program that is designed for your specific facility.
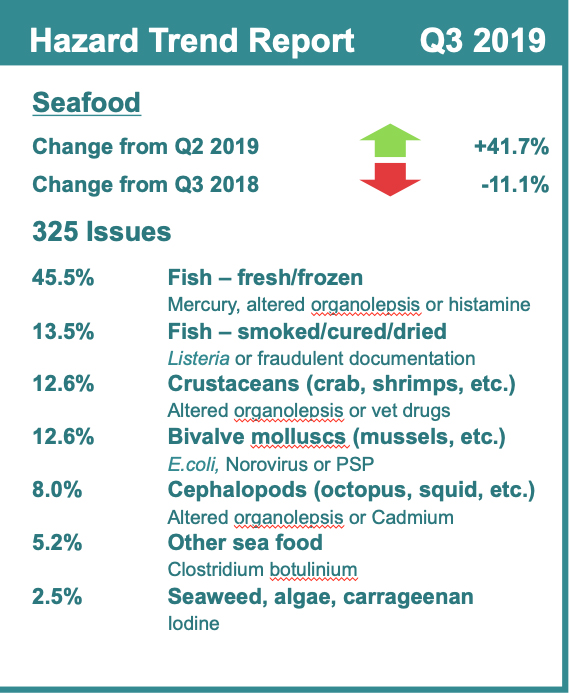
The following infographic is a snapshot of the hazard trends in seafood from Q3 2019. The information has been pulled from the HorizonScan quarterly report, which summarizes recent global adulteration trends using data gathered from more than 120 reliable sources worldwide. Over the past and next few weeks, Food Safety Tech is providing readers with hazard trends from various food categories included in this report.
This website uses cookies so that we can provide you with the best user experience possible. Cookie information is stored in your browser and performs functions such as recognising you when you return to our website and helping our team to understand which sections of the website you find most interesting and useful.
Strictly Necessary Cookies
Strictly Necessary Cookies should be enabled at all times so that we can save your preferences for these cookie settings.
We use tracking pixels that set your arrival time at our website, this is used as part of our anti-spam and security measures. Disabling this tracking pixel would disable some of our security measures, and is therefore considered necessary for the safe operation of the website. This tracking pixel is cleared from your system when you delete files in your history.
We also use cookies to store your preferences regarding the setting of 3rd Party Cookies.
If you visit and/or use the FST Training Calendar, cookies are used to store your search terms, and keep track of which records you have seen already. Without these cookies, the Training Calendar would not work.
If you disable this cookie, we will not be able to save your preferences. This means that every time you visit this website you will need to enable or disable cookies again.
Cookie Policy
A browser cookie is a small piece of data that is stored on your device to help websites and mobile apps remember things about you. Other technologies, including Web storage and identifiers associated with your device, may be used for similar purposes. In this policy, we say “cookies” to discuss all of these technologies.
Our Privacy Policy explains how we collect and use information from and about you when you use This website and certain other Innovative Publishing Co LLC services. This policy explains more about how we use cookies and your related choices.
How We Use Cookies
Data generated from cookies and other behavioral tracking technology is not made available to any outside parties, and is only used in the aggregate to make editorial decisions for the websites. Most browsers are initially set up to accept cookies, but you can reset your browser to refuse all cookies or to indicate when a cookie is being sent by visiting this Cookies Policy page. If your cookies are disabled in the browser, neither the tracking cookie nor the preference cookie is set, and you are in effect opted-out.
In other cases, our advertisers request to use third-party tracking to verify our ad delivery, or to remarket their products and/or services to you on other websites. You may opt-out of these tracking pixels by adjusting the Do Not Track settings in your browser, or by visiting the Network Advertising Initiative Opt Out page.
You have control over whether, how, and when cookies and other tracking technologies are installed on your devices. Although each browser is different, most browsers enable their users to access and edit their cookie preferences in their browser settings. The rejection or disabling of some cookies may impact certain features of the site or to cause some of the website’s services not to function properly.
Individuals may opt-out of 3rd Party Cookies used on IPC websites by adjusting your cookie preferences through this Cookie Preferences tool, or by setting web browser settings to refuse cookies and similar tracking mechanisms. Please note that web browsers operate using different identifiers. As such, you must adjust your settings in each web browser and for each computer or device on which you would like to opt-out on. Further, if you simply delete your cookies, you will need to remove cookies from your device after every visit to the websites. You may download a browser plugin that will help you maintain your opt-out choices by visiting www.aboutads.info/pmc. You may block cookies entirely by disabling cookie use in your browser or by setting your browser to ask for your permission before setting a cookie. Blocking cookies entirely may cause some websites to work incorrectly or less effectively.
The use of online tracking mechanisms by third parties is subject to those third parties’ own privacy policies, and not this Policy. If you prefer to prevent third parties from setting and accessing cookies on your computer, you may set your browser to block all cookies. Additionally, you may remove yourself from the targeted advertising of companies within the Network Advertising Initiative by opting out here, or of companies participating in the Digital Advertising Alliance program by opting out here.