Tag Archives: Focus Article

Ground beef, pink slime

ABC Settles ‘Pink Slime’ Lawsuit with BPI

By Food Safety Tech Staff
1 Comment
Ground beef, pink slime

Today ABC News and Beef Products, Inc. (BPI) settled the $1 billion+ defamation lawsuit over the television network’s coverage of BPI’s lean finely textured beef, which has been infamously referred to “pink slime”. Terms of the deal are not being disclosed.

“We are extraordinarily pleased with this settlement,” stated BPI attorney Dan Webb in a statement outside the Union County Courthouse in Elk Point, South Dakota, as reported by the Sioux City Journal. “I believe we have totally vindicated the product.”

The ABC reports aired in 2012 (reported by Jim Avila) and stated that ground beef sold in supermarkets contained a cheap filler (beef trimmings sprayed with ammonia) that was not labeled as such on the products. The network reported that 70% of ground beef at the supermarket contained pink slime, a term coined by whistleblower and former USDA scientist Gerald Zirnstein.

BPI claimed that following the ABC reports, its revenues reportedly dropped 80% and resulted in layoffs of hundreds of employees. In a written statement, the company called ABC’s reporting “biased and baseless”. The trial began on June 5.

Clive Longbottom, Quocirca

The Internet of Things: What the Future Holds

By Clive Longbottom
1 Comment
Clive Longbottom, Quocirca

While the Internet of Things (IoT) is already having a major impact on safety in the food supply chain we’re only just scratching the surface of what connected devices can do to make the industry safer and more efficient. What strikes us as unique and innovative today will likely become standard across the food industry in the years to come as we find new and better ways to apply the technology in all aspects of the business.

One area we can expect to see the impact of the IoT grow is in a broader adoption of automation across the food supply chain. In the context of farming, we’re likely to see autonomous tractors supplant manually driven tractors as the primary equipment used to prepare land. Automated aerial drones will be able to assess the health of crops and deliver highly targeted applications of fertilizers, insecticides and weed killers to cut down on damage caused to crops by excessive use of those products. Transportation, too, is likely to see the impact of automation as driverless trucks take on the majority of shipments of goods.

Another key benefit the IoT will bring to the food industry is improved access to valuable data and in-depth analysis. This will allow more accurate tracking of shipments, better monitoring of quality throughout the supply chain and more useful prediction of potential problems. It’s here that we’re likely to see the biggest impact on pest management, as a broad network of connected sensors will be better able to identify and track pest populations, monitoring their movement and growth in a way that allows pest management professionals to target treatments more effectively. A recent survey of food professionals conducted by Quocirca and commissioned by Rentokil Initial shows that 20% of respondents think IoT will help them deal with cyclical problems such as pest swarms and seasonal flooding, while 19% believe it will provide the most benefit by alerting them to immediate issues such as unexpected pest infestations.

One thing we know for sure is that the technology will become more widely adopted throughout the industry as innovation drives costs down. Initially it will be difficult for smaller organizations with lower margins to invest in cutting edge technology, but as iteration and innovation push the boundaries of what IoT can do, they will also make more basic applications more affordable, as we’ve seen with technology across many industries in recent years.

While it’s easy to speculate and imagine a sci-fi-inspired future of driverless trucks, automated farm machines and limitless access to deep analytics, accurately predicting the exact applications of the IoT as it develops proves more difficult. What we do know is that we can expect the adoption of these technologies to grow at an increasing rate as more innovative and cost effective applications of the IoT are developed.

Deirdre Schlunegger, STOP Foodborne Illness
Food Safety Culture Club

Dave Theno’s Legacy: Keeping People Safe

By Deirdre Schlunegger
No Comments
Deirdre Schlunegger, STOP Foodborne Illness

I was putting the finishing touches on this month’s blog post when word came of the tragic and untimely death of Dave Theno, a man whose legacy looms large in the world of food safety.

Just last week I was corresponding with Dave about an honor that STOP Foodborne Illness wanted to bestow upon him at our annual December event that honors our Food Safety Heroes. He had enthusiastically accepted and we were excited to start planning.

Stop Foodborne Illness has a history that is inextricably woven with many of the threads from which Dave’s life was made. In 1993, Dave was called in to help the fast food restaurant Jack in the Box manage the crisis that was the result of an E. coli O157:H7 outbreak, which eventually killed four children and sickened hundreds of others.

At a time when most everyone working in food hadn’t yet realized that food safety was not just another facet of their operation, Dave Theno stood in the gap and helped usher in what has become the modern age of food safety. As he helped industry get on the right track, he also dedicated his life to learning the stories and sharing the pain of families affected by foodborne illness, foremost among them being Roni Rudolph, whose daughter Lauren Beth was the first to die. Together with other hurting parents, Roni founded what would become Stop Foodborne Illness; and in the words of our good friend Mary Heersink, “transformed isolated losses into something bigger than individual tragedy.”

Dave loved his job and did it well. With compassionate integrity and the heart of an advocate, Dave’s strong leadership was proof that he understood the seriousness of the tasks before him. His clear vision for a safer world where food was concerned was a testament to his calling. If there is anything we can learn from Dave Theno’s life, it is that the story is about people. The bottom line is about people. Dave’s compass was considering all the other “Lauren Beths” in the world, and keeping people safe.

He will be sorely missed . . .

Beef ban

USDA Suspends Imports of All Fresh Beef from Brazil

By Food Safety Tech Staff
1 Comment
Beef ban

Yesterday Sonny Perdue, U.S. Secretary of Agriculture announced that the USDA would be halting all imports of fresh beef from Brazil. The USDA has been inspecting all of the meat products entering the United States from Brazil since March, and has refused entry to 11% of fresh beef products. According to an agency press release, this figure is “substantially higher than the rejection rate of 1% of shipments from the rest of the world”. The increased inspection has resulted in refusal of entry to about 1.9 million pounds of Brazilian beef products over concerns related to public health, sanitary conditions and animal health.

“Although international trade is an important part of what we do at USDA, and Brazil has long been one of our partners, my first priority is to protect American consumers. That’s what we’ve done by halting the import of Brazilian fresh beef.” – Sonny Perdue, U.S. Secretary of Agriculture

The USDA is suspending shipments until the Brazilian Ministry of Agriculture takes corrective action that the agency finds adequate.

David Theno

Swimming Accident Takes Life of Food Safety Expert David Theno

By Food Safety Tech Staff
3 Comments
David Theno

The news broke this morning that David Theno, one of the most well known experts in the food safety realm, was tragically killed while reportedly snorkeling in Hawaii. He was pronounced dead on Monday following attempts to resuscitate him.

Theno was most notable for his role in implementing new standards in food safety in his position as senior vice president and chief food safety officer at Jack in the Box following the 1993 E. coli O157:H7 outbreak that killed four children. He implemented a HACCP plan and other product testing measures long before it was embraced by many in certain segments of the food industry.

Also a former chief of food safety for Subway, he was in the news over the past week for his testimony in the BPI case versus the ABC network. Theno served as a consultant for BPI from roughly 2010 to 2012, and reportedly reviewed BPI’s food safety practices.

Theno was founder and CEO of his own food safety consulting business, Gray Dog Partners, Inc. He received numerous awards for his outstanding work in food safety during his career, most recently the 2017 NSF Food Safety Leadership Lifetime Achievement Award.

The Validation Conversation

By Joy Dell’Aringa
No Comments

Our industry is in a perpetual food safety discussion. We are constantly mulling over the finer points of hazards, risk, preventive controls, training, sanitation, and regulations. Validation is also a key component of the food safety dialog. Here we will explore common themes industry professionals discuss in regard to validation in this era of food safety.

Definitions

In any good conversation, terms must be set and semantics agreed upon. It is helpful to start off with a simplistic definition of validation and verification that can be applied across industries and applications. We often return to these reductive definitions throughout conversations to recalibrate and ensure that all parties are on the same page.

  • Validation:  Are we using the correct system / method?
  • Verification: Are we using the system / method correctly?

From there, we narrow our focus. Using the FSMA backdrop, from the FDA’s “Draft Guidance for Industry: Control of Listeria monocytogenes in Ready-To-Eat Foods” we find the following definitions:

Validation: Obtaining and evaluating scientific and technical evidence that a control measure, combination of control measures, or the food safety plan as a whole, when properly implemented, is capable of effectively controlling the identified hazards.

Verification: The application of methods, procedures, tests and other evaluations, in addition to monitoring, to determine whether a control measure or combination of control measures is or has been operating as intended and to establish the validity of the food safety plan.

Validation and Verification: Semantics Matter.

Definitions for validation and verification are available from various standards organizations and regulatory bodies. What is most important, however, is that in this conversation there is a clear distinction between validation and verification—both in activities and objectives. These are not interchangeable terms. Further, validation and verification can be discussed from two general perspectives in the food safety landscape. Process validation addresses manufacturing activities and controls to prevent product hazard and contamination. Method validation addresses the analytical methods used to verify the physical, chemical or microbiological properties of a product.

Process Validation

Our industry is comprised of a variety of categorical segments. Each segment faces unique processing challenges, risks and requirements that must be addressed in the validation and verification conversation.

Some segments, such as the dairy industry, have long standing processes in place that have a robust scientific backbone and leave little room for guesswork, experimentation or modification. “Milk  processes were validated years ago and are part of the Pasteurized Milk Ordinance (PMO). The science is there,” states Janet Raddatz, vice president of quality & food safety systems at Sargento Foods, Inc. ” It is well established that when you pasteurize the product for the time and temperature that has been validated, then you simply verify the pasteurizer is working to the validated specifications.”

However, process validation challenges arise when novel applications, ingredients and processes are employed. Even in an established industry, reformulations of products such as sauces and dressings require fresh validation perspective and risk assessment. “You must assess the risk anytime there is a change. Properties such as pH, salt and water are critical variables to the safety and microbial stability of a product. Novel processing techniques aimed at ‘all natural’ or ‘minimal processing’ consumer demands should also be challenged.” Raddatz suggests conducting a full assessment to identify potential areas of risk. A challenge study may also be a critical piece to validate that a certain process or formulation is appropriate.

To help the food industry understand, design and apply good validation and verification practices, the Institute for Food Safety and Health (IFSH) published “Validation and Verification: A Practical, Industry-driven Framework Developed to Support the Requirement of the Food Safety Modernization Act (FSMA) of 2011.” This insightful document provides various definitions, guidance, practical advice, and offers several Dos and Don’ts on validation and verification activities.

Do:

  • Divide validation and verification into separate tasks
  • Think of validation as your scientific evidence and proof the system controls the hazards
  • Use science-based information to support the initial validation
  • Use management to participate in validation development and operations of verification
  • Use lessons from “near-misses” and corrections to adjust and improve the food safety system

Don’t:

  • Confuse the activities of verification with those of routine monitoring
  • Rely on literature or studies that are unlike your process/ product to prove controls are valid
  • Conduct audit processes and then not review the results
  • Perform corrective actions without determining if a system change may be needed to fix the problem
  • Forget, reanalysis is done every three years or sooner if new information or problems suggest

Method Validation

Analytical methods used to verify a validated food process must also be validated for the specific product and conditions under which they will be conducted. For example, a manufacturer that has their laboratory test a product for Salmonella to verify that a kill step in the manufacturing process worked, must ensure that the method the laboratory uses is both validated for that product and has been verified as appropriate for use in that laboratory. Three general considerations should be discussed with the laboratory:

  • Is the method validated for the product (matrix)?
    • Often, the method will carry several matrix validations that were previously conducted by the diagnostic provider, an industry organization or as a reference method.
    • If the matrix to be tested is not validated the laboratory should conduct a validation study before proceeding.
  • Has the laboratory verified this method on the product (matrix)?
    • The laboratory should demonstrate that they can indeed perform the validated method appropriately.
    • Verification activities typically involve a matrix specific spiked recovery.
  • Are there any modifications made to the validated method?
    • All method modifications should be validated and verified. Additionally, modification should be noted on the laboratory report or Certificate of Analysis issued.
    • Method modifications may include time and temperature alterations, media changes and sample preparation factors.

AOAC International is an organization that certifies the validation of methods to a specific prescribed standard. “Diagnostic companies seek AOAC approval, which entails rigorous validation protocol with the selected matrices,” says Ronald Johnson Ph.D., president of AOAC International and associate director of validation for bioMérieux, describes the importance of commercial standardization.  “The AOAC validation scheme ensures that the method is robust, rugged, inclusive and exclusive, stable and meets the sensitivity presented.” Standards such as these provide confidence to the user that the method is fit-for-purpose, a critical first step in method selection.

While many diagnostic companies will perform standardized validation as described above, how a laboratory validates and verifies a method is incredibly nuanced in the food industry. Currently, there is no standardized approach to study design and execution. Even ISO 17025 accredited laboratories are only required to have a validation and verification protocol—there is no dictation about what that protocol should look like.

“Currently, there is a lot of variation in the industry around [method] validation,” says Patrick Bird, microbiology R&D laboratory supervisor at Q Laboratories. Bird is a method validation expert who is on the U.S. ISO TAG TC34/SC9 working group 3 for the new ISO validation and verification standards, including ISO/DIS 16140-4 guidelines, “Microbiology of the food chain – Method Validation – Part 4: Protocol for single-laboratory (in-house) method validation.”

“Variables such as number of replicates, spike levels, and even acceptance criteria vary widely from lab to lab—both in manufacturing laboratories and contract testing laboratories. We hope the ISO guidelines will standardize that, ” says Bird. He goes on to discuss the importance of good laboratory stewardship in the industry. “While some look at validations as a proprietary or competitive advantage, the testing industry must realize that without standardization, poor validation and verification practices by a few can tarnish the great science done by the many, and ultimately jeopardize the safety of our food supply.” He stresses the importance of quality operations and open communications with laboratories, whether in house or third party. “Now that validation is highlighted as a required area in FSMA Preventive Controls, more and more companies are paying attention to the methods and associated validation/verification data their labs can provide.”

Continue to page 2 below.

Amy Kircher, Food Protection and Defense Institute

Supply Chain Awareness Critical to Food Safety

By Maria Fontanazza
No Comments
Amy Kircher, Food Protection and Defense Institute

The supply chain of a single product often involves multiple levels. For a company to adequately evaluate its risk and vulnerability, it must have a grasp on the full extent of its supply chain, according to Amy Kircher, Dr. PH, director, Food Protection and Defense Institute. “When we think about the supply chain there are two points to consider: One is just being aware of the depth and breadth of a supply chain to create a food product. It’s much larger than who you buy from and who you sell to,” says Kircher. “Second is moving from a reactive mentality to a proactive mentality. How do we get ahead and close vulnerabilities before they are exposed or monitor threats to the food system such that we can put mitigations in place.” During a discussion with Food Safety Tech, Kircher shares her perspective on how companies can understand and protect their supply chain.

Amy Kircher, Food Protection and Defense Institute
Amy Kircher, Dr. PH, director, Food Protection and Defense Institute

Food Safety Tech: What are the biggest supply chain threats facing food companies?

Amy Kircher: I think one of the biggest challenges is just understanding the entire food supply chain and all the buying, selling and manufacturing that happens along that line. When food comes from a point of origin—whether it’s a farm or a manufactured nutrient—what are all the steps and movements of that product that then results in the final product that the end consumer buys? Typically companies know at least one [step] back and one [step] forward, but they don’t always know the entire breadth of the particular ingredient that they’re buying. Or, if they’re in the middle of the supply chain, [they may not know] where all of their products may be going if it’s sold multiple times (i.e., a spice as an ingredient). There are exceptions—some companies are vertically integrated and know their entire supply chain. But on average, that is a real challenge: Understanding the complexity of the supply chain, where are you in that process, whom you are buying from, and where the food is going afterwards.

FST: How can companies gain a better understanding of their supply chain?

Kircher: Ask questions of whom you’re buying product from—from where are they sourcing the ingredient or commodity? For example, if you’re making a five-component food product, ask your supplier, where does it get its stock from? From where are you sourcing? Have an open dialogue with your vendors and make sure you have the process in place so if you had to quickly identify where an [ingredient] was from, you could.

Secondly, understand the ingredients that you need to procure and be able to monitor where there might be threats for that particular product or commodity. If you need to buy peppers as an ingredient for a spice blend or a can of soup, [you should] be able to monitor what’s happening in that particular commodity: Has there been an intentional adulteration recently? Any recalls? Have there been weather issues in the part of the world where your particular pepper is sourced? If we know there is a natural disaster in a region, how quickly are you notified? Do you have alternate sources as a backup?

A great example is the Ebola [outbreak]: When Ebola happened, there were changes that were happening with cocoa almost daily, because most of the cocoa is sourced out of West Africa, exactly where Ebola was happening. There were price shifts and some transfer concerns where cargo ships weren’t coming into port in some of those countries. It’s important to have an understanding of the ingredients or commodities that you source and be well aware of what’s happening in that landscape.

FST: What steps should companies take to protect their supply chain?

Kircher: You should be doing vulnerability and risk assessments of your supply chain. Know where there are risks of that particular supply: Those risks could be a multitude of things, be it a natural risk or something related to a change in trade policy. Know where you have vulnerabilities within your system: Where could a particular product be exposed to a vulnerability, either natural or intentional? [From there], start assessing what can be done about it. If there’s a specific ingredient that you need to have to make a particular product, where does it come from and do you have alternative sources? What kind of testing mechanisms do you have in place? Some vendors only have one manufacturing site or one receiving site for a product they’re manufacturing. How secure is that processing plant? Is it in a hurricane zone? Have you had criminal activity there? Understanding where there are vulnerabilities in your supply chain allows you to prioritize which ones you should spend money on mitigating.

FST: What technologies do you find to be the most effective in assessing risks and providing visibility throughout the supply chain?

Kircher: I think there are several products that will help. At the Food Defense and Protection Institute, we have a couple. The first is a supply chain documentation and analysis tool (CRISTAL) that allows you to document your supply chain throughout the whole system. Then it applies weights and algorithms to allow you to see what is most critical in your supply chain, and from there you can look at risks from hazards. For a lot of companies, the first step is to map the entire supply chain. Having technology that allows them to do that efficiently versus drawing or creating an Excel spreadsheet allows them to visualize where they might have gaps/challenges, followed by risk and vulnerability assessment.

Second is horizon scanning, or looking at early indications of warnings of events. Our tool is called FIDES (Focused Integration of Date for Early Signals). It looks at predicative analytics—are there conditions or drivers that are occurring that might result in an emerging event or event that might create a problem? We can always scan and monitor where we might have challenges.

We want to move people from a reactive food protection and defense to a preventive posture where you are starting to be ahead of it [threats] and understand where you might have a risk or vulnerability that gets exposed such that you can mitigate it prior to a consumer purchasing [the product].

Douglas Marshall, Ph.D., Eurofins
Food Genomics

To Be or Not to Be: Choosing the Best Indicator using Microbiomes

By Douglas Marshall, Ph.D., Gregory Siragusa, Ph.D.
1 Comment
Douglas Marshall, Ph.D., Eurofins

Whenever an order is placed for an aerobic plate count, lactic acid bacteria count,  Enterobacteriaceae count, coliform count, fecal coliform count, Escherichia coli count, or yeast and mold count, it involves ordering an indicator test. So obviously, in food and water quality safety analyses, indicator microbiology is a highly routine and frequent activity. In fact, many business-to-business transactions are partially dictated by the outcome of indicator tests in the form of purchase specifications. Raw material producers and ingredient manufacturers are required to deliver products that meet the expectations of the buyer. Should such product exceed the predefined specifications, the expected transaction becomes nullified. Finished food product manufacturers also must meet specifications set by retailers and food service buyers. Some regulatory jurisdictions and public health agencies also are in this game, offering regulatory specifications for targeted groups of indicator microbes, such as EPA water quality specifications or FDA zero tolerance of pathogens in ready-to-eat foods. Here we argue that microbiomes can be a valuable tool to help choose and validate the best indicator(s) that may be used under a variety of circumstances.

The microbial indicator premise is that the presence or population size of a single indicator microbe or groups of microbes has some respective correlation with the presence of or population of either undesirable microbes (spoilers or pathogens) or desirable microbes (starter cultures or probiotics). On the public health side, indicator presence or populations can be used to define risk of an adverse public health outcome. Indicators also have utility in assessing process effectiveness, such as presence or populations of spore formers after a heat process. Sanitation efficacy can be judged by the amount of an appropriate indicator, such as residual ATP on a surface or presence of Listeria spp. in a floor drain. Culture houses (i.e., starter cultures, probiotics) and companies that manufacture fermented foods can do routine QC testing for the amount of metabolic byproducts (CO2 or acid development) as an indicator of microbial activity and also measure culture population levels.

Our customers frequently ask us, “Which is the best indicator for my ingredients, process, and products?”  Of course they are looking for a very simple answer but the reality is, we must know many details about the ingredients, product, process, and intended use before we can offer a best guess. Clearly best guesses, even by esteemed experts, can lead to inappropriate indicator choices. At worse, standard industry practice informed by years of use may not offer appropriate scientific validation of the use of chosen indicators.

Another customer question we frequently hear: “My product is not reaching intended shelf life, but indicator counts show it should be fine. What is causing product performance failure?”  In this scenario, the chosen indicator(s) may not allow for cultivation of the offending microbe, resulting in an “all clear” test result. Each indicator test (see Table I) will grow only the microbes able to multiply on the selected medium, at the selected incubation temperature, for the selected incubation time, and under the selected incubation atmosphere.1 Differences in media brand, or even slight deviations in media nutrition, media selective agents, temperature, time or atmosphere will have dramatic implications on what ultimately grows. What is telling is that there are many microbes in the sample that may not be cultivable at all, yet they may contribute to product performance failures. Wouldn’t it be nice if you could run one test and get a good snapshot of the all microbiota present in the specimen?

A further issue is that some microbes, which  may be perfectly able to grow under a certain set of conditions, might be outgrown by other competitors. Therefore, they may not contribute to the countable population. If they are found as a minor population, the odds of identifying them from a plate count are remote. Such microbes may in fact contribute to product failure and yet never be detected by an indicator assay.

An example of well-publicized historical misuse of indicators is the application of fecal coliform counts as indicators of fecal contamination of some dry leafy food products, such as tea leaves. For decades, periodic popular press exposé articles about food service iced tea with high fecal coliform counts have appeared in the news. The respective author’s dramatic conclusion is that such teas are contaminated with feces and a threat to public health. However, in reality, when the bacteria associated with these high counts were actually identified, they were determined to be natural constituents of dry tea leaves and had no association with animal feces.2

An unconventional hypothetical indicator example seems worthy here. If you are a manufacturer of a dried ready-to-eat product or ingredient and your hazard analysis has identified Salmonella as a reasonably foreseeable environmental hazard, most will choose coliform, fecal coliform, E. coli, and/or Enterobacteriaceae counts as potential indicators. We’re sure this sounds familiar so you’re feeling pretty good about now—well, read on, please. What may be less obvious is the potential usefulness of a yeast and mold count for this purpose, because low-level moisture intrusion may lead to growth of these fungal groups and also may lead to enhanced survival/growth of Salmonella. Therefore, one may find the best indicator by looking for an indicator of moisture control problems rather than an indicator of potential fecal contamination.

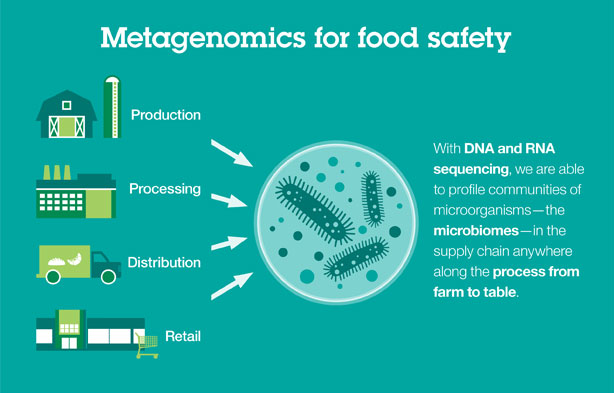
Finally, verification screening of all raw materials, ingredients, processes, environmental locations, and products using traditional microbiology tests can quickly become expensive if you are looking at all the potential indicators shown in the table. By first running a single microbiome on a specimen, the predominant microbes and their relative proportional populations will be determined. This knowledge can be used to develop appropriate targeted verification screening for indicators that you now know are relevant to the specimen. Furthermore, the impact of changes in suppliers, processes, or product formulation can be measured using microbiomes to again gain confidence that appropriate indicators are still being used.

We hope this installment of Food Genomics triggers the reader to rethink the indicators they are using and ask the following questions:

  • Why are we using our chosen indicators?
  • Are our indicators telling us what we really need to know?
  • Are there better indicators for my supplier verification program?
  • Are there better indicators for my process verification program?
  • Are there better indicators for my environmental monitoring program?
  • Are there better indicators that more accurately predict product shelf life?
Indicator Test Uses Microbiome
Aerobic Mesophilic Plate Count Estimate population of microbes able to grow at 35°C with air. Overall food quality indicator, shelf life/spoilage predictor Names of predominant microbes and relative proportions of each constituting the aerobic mesophilic population
Anaerobic Mesophilic Plate Count Estimate populations of microbes able to grow at 35°C without oxygen. Shelf life/spoilage predictor of vacuum packaged or modified atmosphere packaged foods. Names of predominant microbes and relative populations of each constituting the anaerobic mesophilic population
Standard Plate Count Similar to APC but used for dairy products. Estimate population of microbes able to grow at 30°C with air. Overall milk quality indicator, shelf life/spoilage predictor Names of predominant microbes and relative populations of each constituting the aerobic mesophilic population
Psychrotrophic Plate Count Estimate population of microbes able to grow at refrigerated temperatures (incubation temperature can vary from 5° to 15°C) with air. Shelf life/spoilage predictor Names of predominant microbes and relative populations of each constituting the aerobic psychrotrophic population
Anaerobic Psychrotrophic Plate Count Estimate population of microbes able to grow at refrigerated temperatures without oxygen. Refrigerated shelf life/spoilage predictor of vacuum or modified atmosphere packaged foods Names of predominant microbes and relative proportions of each constituting the anaerobic psychrotrophic population
Aerobic Thermophilic Plate Count Estimate population of bacterial spores able to grow at high storage temperatures (incubation temperature can vary but usually >45°C) in air or survive a thermal process. Indicator of process failure. Spoilage indicator of improperly hot held foods Names of predominant spores and relative proportions of each constituting the aerobic thermophilic population
Aerobic Mesophilic Spore Estimate population of bacterial spores able to grow at 35°C with air. May indicate possible Bacillus cereus risk. Names of predominant spores and relative proportions of each constituting the aerobic mesophilic spore population
Anaerobic Mesophilic Spore Count Estimate population of bacterial spores able to grow at 35°C without oxygen. Potential shelf life/spoilage indicator of vacuum or modified atmosphere packaged foods. May indicate possible Clostridium botulinum risk. Names of predominant spores and relative proportions of each constituting the anaerobic spore population
Aerobic Psychrophilic Spore Count Estimate population of bacterial spores able to grow at refrigeration temperature with air. Spoilage indicator of refrigerated foods Names of predominant spores and relative proportions of each constituting the aerobic psychrotrophic spore population
Anaerobic Psychrophilic Spore Count Estimate population of bacterial spores able to grow at refrigeration temperature without oxygen. Potential shelf life/spoilage indicator of refrigerated vacuum or modified atmosphere packaged foods. May indicate possible nonproteolytic Clostridium botulinum risk Names of predominant spores and relative proportions of each constituting the anaerobic psychrotrophic spore population
Aerobic Thermophilic Spore Count Estimate population of bacterial spores able to grow at high temperature in air. Spoilage indicator of heat processed foods. Names of predominant spores and relative proportions of each constituting the aerobic thermophilic spore population
Anaerobic Thermophilic Spore Count Estimate population of bacterial spores able to grow at high temperature without oxygen. Spoilage indicator of heat processed, vacuum or modified atmosphere packaged foods Names of predominant spores and relative proportions of each constituting the anaerobic thermophilic spore population
 Thermoduric Plate Count  Estimate population of microbes able to survive a pasteurization process. Used as a shelf life/spoilage predictor Names of predominant microbes and relative proportions surviving a thermal process
 Lactic Acid Bacteria Count  Estimate population of bacteria able to produce lactic acid during growth. Indicator of fermentation success or spoilage failure Names of predominant microbes and relative proportions that produce lactic acid
 Proteolytic Plate Count  Estimate population of microorganisms that produce protease enzymes. Indicator of putrefactive spoilage potential Names of predominant microbes and relative proportions that produce proteases
 Lipolytic Plate Count  Estimate population of microorganisms that produce lipase enzymes. Indicator of lipid hydrolytic rancidity spoilage potential Names of predominant microbes and relative proportions that produce lipases
 Saccharolytic Plate Count  Estimate population of microorganisms that produce amylase enzymes. Indicator of starch hydrolysis spoilage potential Names of predominant microbes and relative proportions that produce amylases
Pectinolytic Plate Count Estimate population of microorganisms that produce pectinase enzymes. Indicator of pectin hydrolysis spoilage potential Names of predominant microbes and relative proportions that produce pectinases
Aciduric Plate Count Estimate population of microorganisms able to grow in a high acid/low pH food. Indicator of spoilage potential Names of predominant microbes and relative proportions surviving an a high acid product
Aciduric Flat Sour Sporeformer Count Estimate population of bacterial spores able to tolerate high acid foods and produce acid without gas production. Indicator of high-acid canned food spoilage potential Names of predominant bacterial spores and relative proportions that grow in a high-acid canned food
Thermophilic Flat Sour Spore Former Count Estimate population of bacterial spores able to grow at high temperature and produce acid. Indicator of canned food spoilage potential Names of predominant bacterial spores and relative proportions that grow and produce acid in a canned food
Sulfide Sporeformer Count Estimate populations of bacterial spores that produce sulfur aroma compounds. Indicator of canned food spoilage potential Names of predominant bacterial spores that produce sulfur compounds
 Halophilic Plate Count  Estimate population of microorganisms able to grow at high salt concentrations. Indicator of microbes that can spoil low water activity foods  Names of predominant microbes and relative proportions that grow in a high-salt food
 Osmophilic Plate Count  Estimate population of microorganisms able to grow at high sugar concentrations. Indicator of microbes that can spoil low water activity foods  Names of predominant microbes and relative proportions that grow in a high-sugar food
 Yeast & Mold Count  Estimate population of fungal microbes. Indicator of fermentation success (mold-ripened cheeses) or spoilage potential  Names of predominant fungi and relative proportions in a specimen
 Preservative Resistant Yeast & Mold Count  Estimate population of fungi able to grow or survive in the presence of a food preservative. Indicator of spoilage potential  Names of predominant fungi and relative proportions that grow in the presence of a food preservative
 Coliform Count  Estimate population of bacteria able to ferment lactose at 35°C within 48 hours with gas production. Indictor of sanitation failure or possible presence of fecal pathogens  Names of predominant bacteria and relative proportions constituting the coliform population of a specimen
 Fecal Coliform Count  Estimate population of bacteria able to ferment lactose at 44°C within 48 hours with gas production. Indictor of possible presence of fecal pathogens  Names of predominant bacteria and relative proportions constituting the fecal coliform population of a specimen
 E. coli count  Estimate population of Escherichia coli. Indicator of fecal contamination and possible presence of enteric pathogens  A microbiome is not a useful addition for this species-specific test
 Total Enterobacteriaceae Count  Estimate population of bacteria able to ferment glucose at 35°C within 24 hours. Indictor of sanitation failure or possible presence of fecal pathogens Names of predominant bacteria and relative proportions constituting the Enterobacteriaceae population of a specimen
 Enterococcus Plate Count  Estimate population of enterococci. Indicator of possible fecal contamination  Names of predominant bacteria and relative proportions constituting the enterococci population of a specimen
 Listeria spp.  Estimate of the presence/absence of Listeria species in a food or environmental sample. Indicator of the possible presence of the pathogen Listeria monocytogenes  Names of predominant Listeria species and relative proportions constituting the Listeria population of a specimen
 Relative ATP Concentration  Estimate the amount of adenosine triphosphate in a food or environmental sample. Indicator for the presence of living cells (food or microbial). Used as an indicator of proper sanitation  Names of predominant microorganisms and relative proportions constituting the microbial population of a specimen taken at the same site swabbed for ATP
Table I. Common microbial indicator tests and the use of microbiomes for validation of effectiveness.1


References

  1. Salfinger, Y, and M.L. Tortorello. (2015). Compendium of Methods for the Microbiological Examination of Foods, 5th Ed. American Public Health Association, Washington, D.C.
  2. Zhao, T., M.R.S. Clavero, M. Doyle, and L.R. Beuchat. (1997). Health relevance of the presence of fecal coliforms in iced tea and leaf tea. J. Food Prot. 60(3):215-218.
Tim Husen, Rollins Technical Services
Bug Bytes

Sanitation Solutions for Pest Problems

By Tim Husen, Ph.D.
1 Comment
Tim Husen, Rollins Technical Services

It’s no surprise that food manufacturing and processing environments are naturally vulnerable to food safety threats. Food processing environments have all the things a pest needs to thrive: Food, water and shelter. And if poor sanitation is added to the mix, pests can find your food processing plant absolutely irresistible.

An unkempt facility can attract flies, ants, cockroaches and other unwanted common pests such as rodents. All of these common pests could put you or your facility at risk during your next audit.

The good news is pest-related sanitation issues are preventable through proactive and holistic preventive treatment plans. It’s important to establish proper sanitation processes and procedures so that over time, you avoid or reduce the occurrence of pest problems that could cost you major points on an audit and potentially compromise your products.

Many food processing facilities employ integrated pest management (IPM), an approach that helps prevent pest activity before it occurs and uses chemical treatments only as a last resort. The goal with these types of treatments is to give facility managers tools to use in advance of their next audit to stay ahead of pests, to teach employees good practices and to avoid problems before they happen. A good IPM program includes careful documentation of pest issues and the conducive conditions relating to them, as well as any corrective actions taken to resolve them. This documentation is incredibly important not just in solving pest problems, but also in its relevance to FSMA regulations.

When talking to pest management providers, remember that a “one-size fits all” strategy often doesn’t work, so expect your pest control company to recommend a customized plan. Different environments have different “hot spots” (areas where pests typically are present if the conditions are right) and face different pest pressures. However, there are a few key best practices that can be applied to any facility to help protect against pests.

The following guidelines will help to minimize pest activity and prepare for your facility’s next audit.

1. Educate and Enlist Your Employees in the Fight Against Pests

The first step to establishing your sanitation plan is enlisting your staff. One of the strongest building blocks in your defense against pest activity is sanitation. This key component of your IPM plan begins with the vigilance of your employees. Sanitation and pest management aren’t one-and-done tasks. They’re ongoing and you’ll get the best results when the entire staff is on board.

How can they help? Your employees are often the first to notice any potential signs of existing problems, so it’s important to educate them on hot spots where pests could live, what signs they should look for, and what to do if they see a pest issue. Once your employees understand the importance of sanitation, set a zero-tolerance policy for spills, debris and waste. If employees spot a pest, make sure they understand the protocols for documenting its presence. Consider implementing daily, weekly and monthly sanitation routines in addition to an annual deep cleaning.

Finally, enlist your employees to help keep common areas clean, from break rooms to locker rooms. Establish processes to clean up dirty dishes and drink spills, and empty full trash bins immediately. Don’t forget about cleaning the bins themselves! Also, make sure that common refrigerators aren’t filled with past-expiration lunches or snacks. If you’re finding it tough to get employees to participate, most pest management providers will offer a free education program to make employees aware of potential risks and what they can do to help. Sometimes it can help employees to hear from the experts.

2. What’s on the Inside Counts

As the saying goes, what’s on the inside really matters. This is true for the interior sanitation of your processing facility, too. There are a few particularly vulnerable hotspots to be conscious of when putting together your sanitation plan, especially the production floor, the storage areas and the receiving areas.

For obvious reasons, the production floor is one of the most important areas of focus for your sanitation program. Any hygiene issue could directly impact and expose your food products to contamination. Pests love to make their homes in big equipment that is often difficult to access for cleaning. Improper sanitation may lead to bacteria growth on the production line, which poses a major food safety threat. Create a schedule so that all equipment and machinery are sanitized regularly, and don’t forget about paying extra attention to those out-of-sight areas.

Drain flies and other pests live around drains and drain lids. Both should be scrubbed and sanitized regularly to prevent buildup of grease and other gunk that can attract pests. Organic, professional cleaning solutions are a great option to break down tough stains and grime on floors and around drains. These organic cleaners use naturally occurring enzymes and beneficial bacteria to degrade stains, grime and other organic matter build up, which helps reduce the likelihood of drain flies and other pests.

Storage areas are also prone to attracting pests and the potential bacteria they harbor. These cluttered spaces can get filled with extra boxes and other debris, and are perfect locations for pests to hide. Keep these areas clean and clear of clutter so pests have fewer areas to seek shelter and reproduce.

Cockroaches especially love cardboard boxes, so take those to recycling facilities regularly. Remove any equipment that is not being used. If you have re-sealable containers, clean out all the containers before placing new products inside. All containers should be tightly sealed and kept six inches off the floor and 18 inches away from walls. You can also affix mops and other types of cleaning equipment to the wall. Keeping them off the ground will keep them dry and prevent them from sitting in standing water, which is a major hot spot for fly breeding and bacteria build up.

Don’t forget that pests are experts at squeezing under receiving doors and sneaking onto shipments. To prevent unwanted stowaways, ensure your exterior doors form a tight seal when closed and always give delivery trucks and incoming shipments a thorough inspection for pest activity. Pests love to sneak into any opening they can find, so keep building exits, loading docks and other entrances closed as much as possible. Install weather stripping and door sweeps to keep pests out by creating a tight seal around openings. Believe it or not, rats can squeeze through a hole the size of a quarter, mice through a gap the size of a dime, and crawling insect pests through spaces barely noticeable to the human eye. For other cracks and crevices, use weather-resistant sealants to close any openings and consider installing metal mesh for an extra layer of protection against rodents that can gnaw openings to get inside.

3. Don’t Forget the Great Outdoors

To keep your exterior spic and span, create and maintain a regular sanitation schedule for your building’s exterior so it doesn’t become a haven for pests.

Regular pressure washings of sidewalks and walls will knock away any debris or build-up on exterior surfaces and could help remove any bird droppings around the property that could be brought inside by foot traffic. While it seems like a no-brainer, keep dumpsters and recycling collections as far away from facilities as possible, and make sure they are cleaned and sanitized frequently. And like interior cleaning best practices, don’t neglect areas above or out of the line of sight like gutters and rooftop ledges. Sometimes, leaves, standing water and other debris can build up over time, which provides breeding areas and shelter for pests—­especially mosquitoes.

Did you know that flies are not just attracted to food processing facilities because of food smells, but also for their exterior lighting? Flies and other flying insects are attracted to light and may use it for orientation. Mercury-vapor lighting is especially attractive to flies, so consider swapping mercury-vapor lamps next to entryways with sodium-vapor lights or LEDs. And to lure flies away from your building, place your facility’s mercury-vapor lighting at least 100 feet from entrances. It is often important to remember that the best option is always to direct lighting towards a building rather than mount lighting on it.

Good outdoor pest maintenance also includes landscaping. Trim your trees often and keep plants at least 12 inches away from your building. This decreases the chance of pests using vegetation as breeding or nesting grounds and the chances they’ll get access to your facility. Standing water often becomes a breeding site and moisture source that could provide pests like flies, mosquitoes and rodents with water necessary for survival. Remove any standing water around your building to prevent this and remove any reason for those pests to stick around. Look for stagnant water in gutters, ponds, birdbaths, water fountains and any other places that water could sit for more than a week without moving.

These proactive pest management tips will be useful in protecting your building and products from food safety threats. If there are any tasks that require additional help, consider talking to your pest management provider about creating an IPM plan. They will walk through your facility with you to identify any hotspots and suggest potential corrective actions—you’ll be glad you did when it’s time for your next audit.