Why has the food industry been seeing more Listeria outbreaks in recent years? What is the reason behind it? According to Jeff Mitchell, vice president of food safety at Chemstar, the prevalence in Listeria-related recalls may have more to do with the fact that industry is collecting more meaningful data. During a Q&A with Gina Kramer, founder and executive director of Savour Food Safety International, Inc., Mitchell discusses the methods through which industry is collecting data and how food companies should be using a sanitation program to rid facilities of resident Listeria at the 2015 Food Safety Consortium.
Since the introduction of FSMA, food safety has been under a much-needed magnifying glass. Standards for hygiene and accountability are increasing, and companies are implementing more measures to keep consumers safe. One of the ways in which businesses are being proactive is through implementing color-coding plans. If you have not heard of this type of plan yet, it’s time to get schooled; and if you have, this article will provide a quick refresher on why companies are expanding their spectrum on contamination prevention—by literally implementing the color spectrum in their plants and businesses.
What Is A Color-Coded Plan?
A strategy for a plant or business that designates certain colors for a specific area or purpose designed to promote safety and cleanliness.
Example Plans. Although color-coding plans vary by the needs and demands of each plant, the following are the most popular types of color-coding plans currently being practiced in food manufacturing.
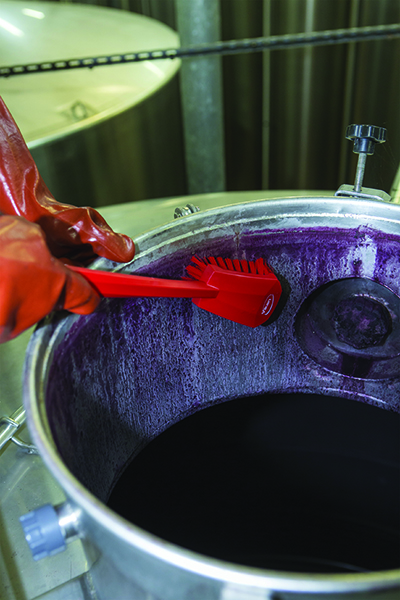
Color coding a cleaning brush can help employees make the distinction when dealing with allergens and potential contamination. All images courtesy of Remco/Vikan
Allergen/Potential Contaminant Distinction
Food Processors and manufactures usually have identified potential allergens and contaminants that pose a risk to the production process. Color distinction for equipment or instruments that come into contact with these potential contaminants is an ideal tool for food safety. Determining the amount of items that fall into this category within your facility is the first step to selecting the appropriate amount of colors to implement. The most basic color-coding plan for this purpose would be to select one color to represent tools that come into contact with a particular risk agent and one color to represent those tools that may be used elsewhere. If a plant has more than one risk agent, this plan may be expanded to include several colors. It is important to remember, however, that simplicity is key in color coding and that additional colors should be implemented strictly on an as-needed basis.
Zone Distinction
Many plants already have identified zones in place based on what is produced in each zone or simply due to operating a large plant. This presents an ideal opportunity to color code zones to keep tools in their proper place.
Shift Distinction
Certain plants that have a large number of employees working different shift times should also consider color coding. Color coding by shift can hold each shift responsible for proper tool use and storage. This approach also allows management to see where work habits may be falling short and where the cost of tool replacement is highest.
Assembly Process Distinction
Plants that have assembly line-like processes can implement color coding if necessary to differentiate tools that belong to each step. For example, this becomes particularly important in plants that deal with products such as meat; obviously you do not want to use the same tools with raw and processed meat. Color coding eliminates the question of whether or not a tool is meant for each step in the process.
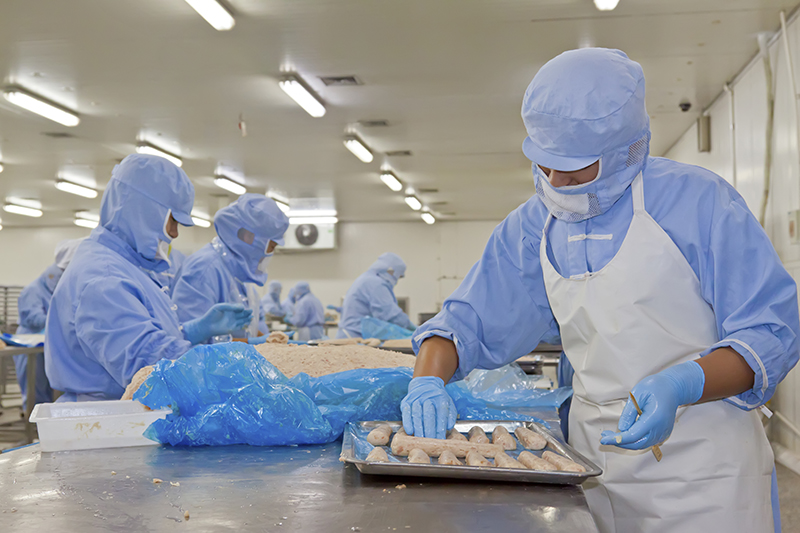
Implement a two-color-coding plan to distinguish between tools used for cleaning versus sanitation.
Cleaning Purpose Distinction
For many food plants, cleaning and sanitizing are processes that are considered different in purpose and practice. Often, there is a specific list for cleaning and then a separate plan for sanitizing. Implementing a two color-coding plan can distinguish tools that are meant for each process.
Why You Need A Color-Coded Plan
It helps meet FSMA requirements. A major part of complying with FSMA regulations is having proper documentation to prove safety measures. Color-coding plans do exactly that, and most providers of these products can provide you with the necessary documentation.
It reduces pathogens and allergens contamination. For food producers, this is the most important reason to implement color coding. There is nothing worse for a company than experiencing product contamination or a recall; this is one step that may prevent such events from occurring.
It is easy to understand. Color coding works so well because it is so simple. All employees, even those who may not speak the same language or are unable to read posters and manuals that dictate proper procedures, can easily comprehend it.
It creates a culture that holds employees accountable. Managers enjoy color-coding practice because it is a simple measure that really works to hold employees accountable in the proper use of tools. It becomes much more obvious when a brightly colored tool is out of place, and thus workers are more likely to follow proper procedure.
For consumers and manufacturers, product quality and cleanliness are a preeminent priority. Product recalls resulting from manufacturing errors in sanitation often warrant national headlines and cause widespread mistrust and panic among consumers.
After a tumultuous spring and summer, Blue Bell Creameries, a Texas-based ice cream manufacturer, will be restocking its products in select grocery store freezers in five phases. The popular brand was forced to recall its products due to Listeria contamination, which has been blamed for the deaths of three people.
Learning from these instances can greatly reduce the number of sanitation-related issues in the future. Investing in sanitation not only increases safety but does wonders for performance and efficiency.
How can sanitation be a competitive advantage and not a troublesome necessity? It’s all about OEE.
Investing in sanitation efficiency now will pay off later. Image courtesy of Myrtle Consulting Group
While not investing in sanitation may save you a little money in the short-run, neglecting it can cause exponentially larger costs down the road, including elevated food scrap, equipment reliability failures, excessive non-value adding to production time, expensive recalls, remediation costs, potential legal liability, and destroyed consumer trust.
A focus on Overall Equipment Effectiveness (OEE) will increase capacity without investment or additional resources, and it does not need to be overly difficult or expensive. However, OEE management does require detailed process analysis, process rethinking, reconstructing of resource assignments, and installation of management control and reporting systems. When equipment is scheduled to run, it’s running at the correct rate, using the right number of resources and at the right level of quality. This will not only boost the efficiency of your operation, but the safety and quality of it as well.
An Important Piece of the Puzzle
Adopting lean techniques into your sanitation plan is an effective and efficient way to improve process time. With this approach, you can determine:
Using LEAN will allow you focus in on three essential areas: the elimination of waste, reduction in variability and reduction of inflexibility. When these factors come together, work can be completed in a standardized, efficient and sanitary manner.
Study. Streamline. Standardize.
Product recalls due to manufacturing errors in sanitation cause mistrust among consumers. Image courtesy of Myrtle Consulting Group
Study. To incorporate, improve or ensure sanitation, the first step is to evaluate what you’re working with. Take the time to examine existing protocols and contracts. Conducting a detailed study of the current processes can help you define the areas that need work, which may include equipment effectiveness, supervisory staff and materials used.
Streamline. Once you obtain the initial result of the study, goals and plans can be determined to streamline the process and make everything run more efficiently. It is not unusual to discover at least 30% of non-valued time within the existing process, mainly due to poor planning, poor coordination or the use of overly cumbersome methods.
Standardize. After creating a plan to improve effectiveness and sanitation, swift and certain implementation of these ideas are critical to maintain commitment and realize results. With a detailed plan, sanitation of machines and other supplies can be executed in an exact, timely fashion.
Placing Sanitation Operation First
One of the biggest mistakes that can be made in manufacturing is viewing sanitation operations as secondary in importance. This attitude can lead to all kinds of oversight and carelessness, which can cause costly mistakes. Clear expectations, clear roles and responsibilities, and measured performance are the hallmarks of well-executed operations and an effective way to make sanitation a priority.
Dramatic Improvements, Significant Savings
Making these changes to increase efficiency and sanitation have yielded dramatic improvements for manufacturers. A large U.S. food manufacturer installed this system in five of their plants and quickly cut costs while boosting productivity. One of the plants was able to repatriate production outsourced to a co-manufacturer at a savings of approximately $500,000. Another replaced its entire 50+ person sanitation crew with a subcontract cleaning crew, reducing its labor cost from $22 to $11.47 an hour, while at the same time increasing the work effectiveness of the crew and performing 15% more sanitation work within the same time frame.
Manufacturing isn’t only about quantity; it involves ensuring a level of quality that builds consumer loyalty and efficiency. When your product potentially poses risk for the consumer, it also poses a danger to your business and its success. Remember, you don’t have to risk using unsanitary methods for the sake of saving money or increasing efficiency. In fact, sanitation and efficiency are easily attainable when they are brought together in a strategic plan. Putting in the time and dedication to create an effective sanitation plan will help you avoid negative consequences and bring you to the top of your game. Stay clean.
As a result of several recent high-profile Listeria-related recalls, interest in the foodborne pathogen is increasing and food processors must take preventive measures to keep it out of facilities.
Listeria monocytogenes is a gram-positive bacteria. It has 13 serotypes, three of which have been associated with the vast majority of foodborne infections (called listeriosis). Although it is not a leading cause of foodborne illness, it is among the leading causes of death from foodborne illness. This hardy pathogen is salt tolerant, thrives in cold, moist environments and can grow under refrigeration temperatures. Listeria is found throughout our environment including in soil, water, sewage, decaying vegetation and even some animals. Its presence has most often been identified in foods such as raw or under-pasteurized milk, smoked fish, deli meats, soft cheeses and raw vegetables.
For a healthy individual, Listeria may cause mild symptoms or have no effect at all. Fever, muscle aches, nausea, vomiting and diarrhea are common signs of infection. For the e immunocompromised (the very young or old, pregnant women, or adults with weakened immune systems), symptoms can be more severe and include septicemia and meningitis; in pregnant women, it can cause miscarriage. Symptom-onset ranges from a few hours to two–three days, with durations lasting from days to several weeks, depending on the severity of infection.
Keep Listeria Out of Your Plant
The first line of defense against Listeria contamination is to keep it out of a facility, but that may not always be possible, thus a Listeria prevention plan should be integrated into a company’s food safety program, considering the following areas:
Employees—can be brought in on shoes and clothing, or through infected workers. Prevention includes:
Good Manufacturing Practices
Personnel Hygiene—proper hand washing, wearing clean clothes and shoes, wearing proper hair restraints
Employee Illness Policy—restriction/exclusion of ill employees
Raw Materials—introduction into the environment from raw ingredients (milk, fish, seafood, produce), pallets, cardboard, packaging material. Prevention includes:
Supply Chain Management
Supplier Approval Program—having strategic partners that ensure only safe, high-quality raw materials
Ingredient Management—requesting COAs, letters of guarantee, allergen control
Receiving/Storage Procedures—completing incoming inspections, proper nonconforming material handling
Processing Aids—harborage in ice, brine solutions, improperly filtered compressed air and HVAC units. Prevention includes:
Sanitation Program—proper cleaning/sanitizing of equipment
Preventative Maintenance—regular replacement/maintenance on filters/motors
Equipment Design—contamination of conveyor belts, filling and packaging equipment, slicers/dicers, ice makers, hoses, equipment framework, condensate drip pans, maintenance tools, trash cans, tools for cleaning equipment (brushes and scouring pads). Prevention includes:
Sanitary Equipment Design – ensuring that all equipment can be broken down as far as possible and properly cleaned and sanitized to remove dirt, debris and micro-organisms
Process Flow—not maintaining segregation of high vs. low risk, clean vs. dirty. Prevention includes:
Separation of high-risk vs low-risk areas through time, space or physical barriers
Proper garb (smocks, hair restraints, captive shoe policy) and sanitary measures (hand wash and sanitize, shoe sanitizer) to reduce introduction into high-risk areas
Proper personnel flow or movement to prevent cross-contamination
Environmental Monitoring Program—tool to identify gaps and risk used improperly resulting in missed problems. Prevention includes:
Robust Sampling Plan—identify zones and sampling areas
Effective Track & Trend Tool—identify gaps or risk that require corrective/preventive action
Timely Corrective Action— ensure proper follow-up on any issues that arise
First Person: The Listeria Experience and Lessons Learned
The above list is by no means exhaustive when it comes to all the areas you need to consider when completing a gap analysis within your facility. Listeria can be very insidious, and you will need to be ever-vigilant to ensure it does not take hold in your environment. Believe me, I have been there when it has.
Once upon a time, I worked for a Ready-to-Eat processing plant. We had robust food safety and quality assurance programs. We employed two microbiologists and had a good environmental monitoring program. The sanitation team did a thorough job of cleaning and sanitizing every night, and we completed preoperational sanitation inspections (including ATP testing) every morning.
Then we had a Listeria recall.
It started out small. One sample tested by FDA came back positive. Then another…and another. More intensive environmental testing found Listeria in the plant—in the drains, in the hard to reach areas of the old slicers and MAP packaging equipment, and even in the production room cooling units.
After many, many hours of cleaning, sanitizing, testing and retesting, we determined that the current layout of the facility would never allow for complete elimination of the Listeria. We had one big production room where raw material was brought in and broken down, fed into the processing lines and assembled, and lastly, finished product was placed into the packaging, which then went into cases and onto wooden pallets. There was no separation of high-risk areas from low risk.
So, what did we do? We set up a temporary location for production (which was a major project in and of itself), redesigned the process flow, shut down the plant, and remodeled our production area.
Highlights of the redesign included:
Building a cleanroom for the production area. We walled off the raw material handling area by the receiving warehouse, enclosed the packaging area by the shipping warehouse, and made the room that housed the processing lines a cleanroom/high-risk room. Entry into the room required appropriate garb (clean smocks, hair restraints, gloves, captive shoes), use of the hands-free hand wash and sanitizer, and a pass through the boot sanitizer. The temperature of the room was reduced from 50oF to 38oF to discourage pathogen growth.
Setting up a raw material handling room. A separate “dirty” area was built to break down raw material components and remove them from their packaging (corrugate cases, plastic wrap). Raw material was then fed through a wall opening where a UV light was mounted to “sanitize” the outside of the material. This helped to reduce the introduction of cardboard packaging and wood pallets into the cleanroom and drive down any pathogens that might be on the surface of the raw material.
Adding a packaging room. All sealed, packaged finished product passed through a wall opening into the packaging room where it was boxed up and placed on pallets. This also helped to reduce the introduction of cardboard and wood into the clean room.
The new process flow allowed for employees to move from the “clean” processing room to the raw material or packaging rooms without any extra precautions, but they were required to go back through the clean room procedures prior to going back to the processing area. Raw material and packaging employees were excluded from the cleanroom to minimize potential of contamination from personnel flow.
We also reevaluated our Hazard Analysis and Critical Control Points (HACCP), Sanitation Standard Operating Procedures (SSOPs), and Sanitation and Environmental Monitoring (EM) programs to ensure all potential risk was identified and addressed either through the new facility design or other control measures. One key takeaway was to use the EM program to identify gaps and areas of opportunity rather than to just try to prove that everything is fine. We learned that having a comprehensive EM program that can capture all the necessary data points, analyze trends and drive corrective action helped our team use the program to drive food safety and continuous improvement. It wasn’t good enough to just have an EM program in place; we needed to use the data to address gaps and mitigate identified risks.
Conclusion
Foodborne pathogens are one of the biggest risks to the safety of our foods. Listeria poses a threat to a number of food categories (dairy, protein, and produce) and should be highlighted as a significant hazard to be assessed when developing and implementing your food safety programs. Using risk-based preventive controls within your facility will help prevent adverse events related to Listeria.
There are several factors that must be considered when selecting a reliable and accurate system for detecting adenosine triphosphate.
A common way to assess the effectiveness of cleaning and sanitation programs in food manufacturing facilities is through the use of methods that detect adenosine triphosphate (ATP). Methods based on ATP detection are inexpensive and rapid, and provide the ability to perform onsite in real-time. There are several manufacturers of ATP-based methods, but choosing the most reliable one can be a daunting task. This article will discuss how these methods work and which factors should be considered to make an informed purchasing decision.
ATP is the universal energy currency in all living cells. It is present in all viable microorganisms (with the exception of viruses) and in foodstuffs. High amounts of ATP can be found in some fresh foods like vegetables, while other foods, especially highly processed foods such as fats, oils or sugar, contain very low amounts of this molecule. It is also important to know that ATP can be found in the environment in its free form hours after a cell has died.1 An ATP bioluminescence assay operates on the principle that ATP in food/food residues and microorganisms, in the presence of a luciferin/luciferase complex, leads to light emission. This light can be measured quantitatively by a luminometer (light-detecting instrument), with results available in 10–40 seconds. The amount of light emitted is proportional to the amount of ATP on a surface and hence its cleanliness. The light emitted is typically measured in relative light units (RLUs), calibrated for each make of instrument and set of reagents. Therefore, the readings obtained from assessing the cleaning of food manufacturing facilities need to be compared with baseline data representing acceptable clean values.
Varying Optical Components
Luminometers have evolved over the years from very large and cumbersome in size to small handheld models that can be used anywhere within a manufacturing facility. Although several components are housed inside these instruments, the optical component is the most important part of a luminometer. Used to detect light coming from the ATP/luciferin/luciferase reaction, the optical component is the defining factor related to luminometer reliability, sensitivity and repeatability. Good luminometers use a photomultiplier tube (PMT) in the light detection system; however, as part of the drive toward cheaper and smaller instruments, some manufacturers have replaced PMTs with less-sensitive photodiode-based systems. When using photodiodes, the swab chemistry must be adapted to produce more intense light. This results in a shorter duration of light, decreasing the time window allotted to place the swab in the luminometer and obtain an accurate read. A PMT, however, multiplies the electrical current produced when light strikes it by millions of times, allowing this optical device to detect a single photon. This approach emits light over a longer period of time. Although the weight of the system is also dependent on factors such as the battery, case and the display screen, a luminometer constructed with a photodiode will generally weigh less than a luminometer constructed with a PMT, since the former is smaller than the latter.
Sensitivity Testing
When an ATP hygiene monitoring system has poor sensitivity or repeatability, there is substantial risk that the test result does not truly represent the hygienic status of the location tested. Therefore, it may provide false positives leading to unnecessary chemical and labor costs and production delays, or false negatives leading to the use of contaminated pieces of equipment. A system that is sensitive to low-level contamination of a surface by microorganisms and/or food residues allows sanitarians to more accurately understand the status of a test point. The ability of a system to repeat results gives one peace of mind that the result is reliable and the actions taken are appropriate. To test different ATP systems for sensitivity, one can run the following simple test using at least eight swabs per system:
• Make at least four serial dilutions of a microbial culture and a food product in a sterile phosphate buffer solution. • Using an accurate pipette, dispense 20 μl of these dilutions carefully onto the tip of the swabs of each ATP system and read the swabs in the respective luminometer, following the manufacturer’s instructions. • Use caution when dispensing the inoculum onto the swab head to prevent any sample loss or spillage. In addition, it is very important the swabs are inoculated immediately prior to reading, which means that each swab should be inoculated one at a time and read in the respective luminometer. Repeat this process for all the swabs.
To test different ATP systems for sensitivity, one can run a simple test using at least eight swabs per system. Photo courtesy of 3M
The most sensitive system will be the one that results in the most “fail results” (using the manufacturers’ recommended pass/caution/fail limits).
One can also test different ATP systems for repeatability by the following test:
• Prepare a dilution of a standard ATP positive control or a food product such as fluid milk in a sterile phosphate buffer. If using a standard ATP positive control, follow the manufacturer’s direction to prepare dilution. If using fluid milk, add 1 ml of milk into 99 ml of phosphate buffer. • Using an accurate pipette, dispense 20 μl of this standard onto the tip of the swabs of each ATP system and read these swabs in their respective luminometer, following the manufacturer’s instructions. • Prepare and read at least 10 swabs for each system you are evaluating, and capture the results on a digital spreadsheet. • Once all 10 swab results (for each system) are in the spreadsheet, calculate the mean (=average) and standard deviation (=stdev) for each system’s data set. Divide the standard deviation by the mean and transform the result in percentage; this value is called the coefficient of variation percentage (CV%). The test with the lowest CV% is the most repeatable and will provide the most reliable information to help make the correct decisions for a food manufacturing facility.
Choosing the Right ATP System
There are many ATP systems available on the market to support cleaning and sanitation verification in manufacturing plants. Some systems are more reliable than others and will provide results that are meaningful, accurate and repeatable. Be sure, therefore, not to choose a system solely based on its price. Check for the quality of the instrument, ask the sales representative what kind of optical device is used in the construction of the instrument and, moreover, perform an evaluation running tests for both sensitivity and repeatability. It is also important to consider the functionality and usability of the software provided with the system to ensure that the software can be used to customize sample plans, store test results and produce reports and graphs.
Reference
Jay, J. M., Loessner, M. J., & Golden, D. A. (2008). Modern Food Microbiology.
About the Author:
Camila Gadotti, M.S., is a field technical service professional and Michael Hughes is a technical service professional with 3M Food Safety.
Cleaning and sanitation programs are indispensable in a food manufacturing plant, as they assure the safety and quality of food being produced. These programs are also key in protecting the integrity of your brand. Because of these programs’ importance, 3M Food Safety sent out a survey this summer toFood Safety Tech readers to learn more about how their manufacturing plants are checked for cleaning and sanitation effectiveness.
Here is what we heard back from 155 respondents:
Only 5.8 percent do not perform any type of cleaning and sanitation validation program in their facilities.
Of the 94.2 percent that do have a cleaning and sanitation validation program in place, 92 percent use more than one method to verify cleaning and sanitation effectiveness.
The methods of choice in order of higher preference were: visual check (86.8 percent), microbial testing (80.5 percent), ATP swabs (70.1 percent) and protein swabs (25.7 percent).
The most used combination of tests was visual checks along with ATP swabs (70 percent).
Analyzing the survey results, Camila Gadotti, Professional Service Account Representative for 3M Food Safety Department was surprised there were still a proportion of respondents (though small) who didn’t have a cleaning and sanitation program in place. “This is such an important part of food safety and quality, and yet we still have some people who don’t have a program in place. Also majority of people still rely on visual check, which is not a good system for a sanitation program.”
Since respondents could check more than one choice for which method they used, a lot of people did visual check in conjunction with other microbial or ATP swab testing. Of these methods, Gadotti pointed out that microbial testing, given that it could take 24 to 48 hours to get results, would be a slow process. “In this time frame, the product could have been sold in the market. So while the test results could still be used for corrective steps to improve sanitation, it’s not the ideal choice for testing.”
Instead, ATP swabs would be a faster and more sensitive alternative, she adds. “ATP swabs work on the science that every live cell contains ATP. This is not just microbial cells, but also product residue, which will generate light based on the chemistry of the product. And results are back in 10 seconds. So you can walk around, collect swabs, put them in the illuminator, and you will very quickly get a number, which is the Relative Light Unit. If the RLU level is considered safe, the facility is clean.” With new and stricter regulations on the food industry horizon, companies are increasingly moving to adopt ATP swab for their sanitation programs, says Gadotti.
Besides which method to choose, another important step in creating a cleaning and sanitation validation plan is the number of sampling sites to be tested. Readers were asked how many locations they test for and there was a wide spread of answers:
65.3 percent test between 5 to 20 different locations in their plants for cleaning and sanitation effectiveness;
14.6 percent of the respondents test between 20 to 30 locations;
6.2 percent of the respondents test between 30 to 40 locations;
3.5 percent of the respondents test between 40 to 50 locations; and
10.4 percent of the respondents test more than 50 locations.
The respondents of this survey work in facilities that range from fresh cut fruits and vegetables to dairy, confectionery, meat and poultry plants. Each of these facilities chose validation methods that were deemed appropriate to support their cleaning and sanitation plans in their manufacturing plants. Although some methods are more common than others, choosing the right method for each processing plant will depend on factors like the type of food being produced, turn-around time, product label claims and, of course, cost.
Another observation from the survey was that people still see verification of sanitation program as an expense. Instead companies need to view this as an investment for the company and its food safety program, Gadotti says.
“Verifying the effectiveness of your cleaning and sanitation program does not need to be a lengthy and troublesome task. Adopting a couple different methods of verification, such as visual checks, microbial testing and/or ATP swabs, tested for in a couple dozen strategic locations throughout your plant should suffice to verify that your plant has been properly cleaned and sanitized. Remember, verifying cleaning and sanitation may help you prevent many issues like reduced shelf-life in your products and unnecessary product recalls,” she sums up.
Norovirus is the number one cause of foodborne disease outbreaks worldwide. It makes people sick causing nausea, stomach cramping, vomiting and diarrhea or “stomach flu” and leads to a lot of discomfort and even death, especially in vulnerable populations like children and the elderly. Elevated risk of infection is associated with certain foods that are served raw, like fruits and vegetables, contaminated ready-to-eat (RTE) foods, or improperly cooked Oysters from contaminated waters. According to the CDC, Norovirus is the leading cause of illness and outbreaks from contaminated foods in the United States, especially in retail foodservice settings like restaurants.
Some of the potential sources of Norovirus outbreaks in retail foodservice are as follows:
Infected food handlers
Infected non-food workers and guests
Bare hands contact with RTE foods
Contamination of food deliveries at source
Improper cleaning and disposal of body fluids
Training gap on sanitizer and disinfectant use
Aerosolized vomitus around food and people
Contaminated food contact and non-food contact surfaces
Improper hand washing by food handlers
Cross contamination from restrooms
Cross contamination from high touch points in the back of the house
It is apparent from the statistics that Norovirus constitutes a major hazard to the retail foodservice industry. The good news, however, is that there are a lot of cost-effective strategies that can be implemented in a proactive manner to reduce its spread and impact on businesses, protect customers and the bottom line. Some of these preventive measures will be discussed here and in next week’s blog post.
Proper Hand Washing by Foodservice Workers
Proper hand washing is the most cost-effective method for preventing cross-contaminations including Norovirus in a retail foodservice environment. Hand wash sinks should be appropriately located to encourage compliance by both foodservice workers and guests. For example; the food code requires handling dry clean dishes with clean hands during the dish washing process. Thus, it makes a lot sense to install a hand wash sink in close proximity to an automated dishwasher. This will enhance hand washing compliance by Team Members before handling and stacking dry clean dishes. Adequate soap and hand sanitizers should be provided at all hand washing stations including restrooms. Whereas the use of hand sanitizers is not a replacement for proper hand washing with soap, there is evidence that hand sanitizers are effective against Norovirus. Proper hand washing remains the preferred option however, since the use of soap can indeed get rid of other cross contaminating organic matter and dirt. Incentive programs may be used to encourage frequent and proper hand washing by foodservice workers. More resources may be found at handwashingforlife.com to help foodservice establishments update their hand washing culture.
While enforcing proper hand washing among foodservice employees is desirable, it is also advisable to encourage hand washing among guests. Norovirus can be transmitted by infected guests to the foodservice establishment especially in buffet style restaurants where guests come in very close proximity with RTE foods. Facility design that encourages hand washing by guests was elegantly captured by the Florida based PDQ restaurant chain that installed a hand wash sink in their main dining room with a strong brand statement that “quality and clean go hand in hand”. The strategic location of a hand wash sink encourages hand washing by guests, especially among children in the full view of their parents, and with less cross contaminating contact surfaces as found in the restrooms.
Restroom Cleaning and Sanitation
Color coded cleaning and sanitizing tools are recommended for restrooms to prevent cross contamination. Tools will be dedicated for use in restrooms only and stored in a dedicated storage or closet to avoid accidental use in other areas of the foodservice establishment. The restroom can be the most important part of the restaurant with opportunities to prevent infections. Guests may also use the cleanliness of the restroom as a measure of food safety commitment by the retail food establishment (see my previous blog on “Clean Matters”). Thus, extra efforts are required to maintain and keep restrooms in a clean and sanitary condition all the time. Use of disinfectant grade chemicals for disinfecting restrooms, body fluids clean-up and high touch point areas is recommended. The alternative of preparing high concentration sanitizers is laborious and prone to mistakes by foodservice workers. In addition, such high concentrated sanitizers like 1000 – 5000 ppm chlorine-based sanitizer can be a safety concern to employees when used without PPEs. Frequent cleaning, disinfecting and replenishing of hand soap and sanitizers in the restroom are effective measures against restroom infections and cross contaminations including Norovirus.
Stay tuned for more preventative measures to be discussed in next week’s blog post…
This website uses cookies so that we can provide you with the best user experience possible. Cookie information is stored in your browser and performs functions such as recognising you when you return to our website and helping our team to understand which sections of the website you find most interesting and useful.
Strictly Necessary Cookies
Strictly Necessary Cookies should be enabled at all times so that we can save your preferences for these cookie settings.
We use tracking pixels that set your arrival time at our website, this is used as part of our anti-spam and security measures. Disabling this tracking pixel would disable some of our security measures, and is therefore considered necessary for the safe operation of the website. This tracking pixel is cleared from your system when you delete files in your history.
We also use cookies to store your preferences regarding the setting of 3rd Party Cookies.
If you visit and/or use the FST Training Calendar, cookies are used to store your search terms, and keep track of which records you have seen already. Without these cookies, the Training Calendar would not work.
If you disable this cookie, we will not be able to save your preferences. This means that every time you visit this website you will need to enable or disable cookies again.
Cookie Policy
A browser cookie is a small piece of data that is stored on your device to help websites and mobile apps remember things about you. Other technologies, including Web storage and identifiers associated with your device, may be used for similar purposes. In this policy, we say “cookies” to discuss all of these technologies.
Our Privacy Policy explains how we collect and use information from and about you when you use This website and certain other Innovative Publishing Co LLC services. This policy explains more about how we use cookies and your related choices.
How We Use Cookies
Data generated from cookies and other behavioral tracking technology is not made available to any outside parties, and is only used in the aggregate to make editorial decisions for the websites. Most browsers are initially set up to accept cookies, but you can reset your browser to refuse all cookies or to indicate when a cookie is being sent by visiting this Cookies Policy page. If your cookies are disabled in the browser, neither the tracking cookie nor the preference cookie is set, and you are in effect opted-out.
In other cases, our advertisers request to use third-party tracking to verify our ad delivery, or to remarket their products and/or services to you on other websites. You may opt-out of these tracking pixels by adjusting the Do Not Track settings in your browser, or by visiting the Network Advertising Initiative Opt Out page.
You have control over whether, how, and when cookies and other tracking technologies are installed on your devices. Although each browser is different, most browsers enable their users to access and edit their cookie preferences in their browser settings. The rejection or disabling of some cookies may impact certain features of the site or to cause some of the website’s services not to function properly.
Individuals may opt-out of 3rd Party Cookies used on IPC websites by adjusting your cookie preferences through this Cookie Preferences tool, or by setting web browser settings to refuse cookies and similar tracking mechanisms. Please note that web browsers operate using different identifiers. As such, you must adjust your settings in each web browser and for each computer or device on which you would like to opt-out on. Further, if you simply delete your cookies, you will need to remove cookies from your device after every visit to the websites. You may download a browser plugin that will help you maintain your opt-out choices by visiting www.aboutads.info/pmc. You may block cookies entirely by disabling cookie use in your browser or by setting your browser to ask for your permission before setting a cookie. Blocking cookies entirely may cause some websites to work incorrectly or less effectively.
The use of online tracking mechanisms by third parties is subject to those third parties’ own privacy policies, and not this Policy. If you prefer to prevent third parties from setting and accessing cookies on your computer, you may set your browser to block all cookies. Additionally, you may remove yourself from the targeted advertising of companies within the Network Advertising Initiative by opting out here, or of companies participating in the Digital Advertising Alliance program by opting out here.