James Gunn-Wilkerson, CMX
Retail Food Safety Forum

The Future Is Now: AI Takes Journey from Supply Chain to Today’s Restaurant Kitchens

By James Gunn-Wilkerson
No Comments
James Gunn-Wilkerson, CMX

Futurist Ross Dawson has said that AI and automation will shape the future of work, and it also promises to transform our lives beyond the office. According to the World Economic Forum, when AI, which provides the ability to “enable devices to learn, reason and process information like humans,” is combined with Internet of Things (IoT) devices and systems, it creates AIoT. This super duo has the potential to power smart homes, smart cities, smart industries and even our smartwatches and fitness trackers, a market estimated by Gartner to be worth $87 billion by 2023. More importantly, this “interconnectedness” will change the way we interact with our devices as well as the way we will live and work in the future.

In the restaurant industry, we’re already seeing glimpses of this interconnectedness take shape, and in the past year, we’ve experienced major technological advancements that have transformed every facet of the way food establishments work. Reflecting on those advancements, I want to take a moment to share three areas of AI impact that are bubbling up in the restaurant sector in 2021.

1: AI-powered Intelligent Kitchens

From ghost kitchens to traditional kitchens, the “back of the house” continues to be a prime target for AI and automation. While great progress has been made, in many ways it seems like we’ve only scratched the surface when it comes to how far AI can take today’s restaurants. But every now and then, we hear examples of AI powering the future of our industry. For example, Nala Robotics, Inc. will be opening what it calls “the world’s first state-of-the-art intelligent restaurant” in Naperville, Illinois this year. The company says the AI-based robotic kitchen “can create dishes from any cuisine around the world, using authentic recipes from celebrated chefs”. A press release from Nala Robotics states that its flagship restaurant is taking “the first step in the food service industry with AI-powered service, addressing many of the issues affecting restaurant owners during COVID-19,” and it will “provide consumers an endless variety of cuisine without potential contamination from human contact.” This is the new frontier in intelligent kitchens, and it couldn’t have come at a better time, with the pandemic forcing restaurants to reimagine the way they do business.

2: AI-Driven Labor Shifts.

You can’t talk about AI in the restaurant industry without also having a conversation about the implications for the modern workforce. With AI in restaurant kitchens and beyond, the impact on the labor force is undeniable. By 2024, Gartner predicts “that these technologies will replace almost 69% of the manager’s workload.” But that’s not entirely a bad thing. Instead of manually filling out forms and updating records, managers can turn to AI to automate these and other tedious tasks. “By using AI…they can spend less time managing transactions and can invest more time on learning, performance management and goal setting,” Gartner adds.Managers can also use the extra time to focus more effort on the customer and employee experience. And indeed they should: In a recent Deloitte report, 60% of guests surveyed indicated that a positive experience would influence them to dine at a restaurant more frequently.

Looking at the impact of AI on labor at all levels, from the CEO to the entry-level wage earner, the shift, at its best, will be a transition to more meaningful—and less mundane—work. The evolution of humanity has taken us to the point we’re now at now, with food production and delivery processes becoming increasingly automated. This has been an evolution generations in the making. In an ideal world, everyone at every level of the organization should benefit from this new wave of technology. For example, automation can and should be used to open the door to new training and new opportunities for low-wage earners to learn new skills that elevate career paths, increase income and improve quality of life.

3: AI and Global Supply Chain Transformation

From the farm all the way to the table, AI is now poised to transform the global supply chain. From my perspective, the biggest impact will be around driving sustainability efforts. Restaurant and grocery brands are already beginning to leverage AI to forecast their food supply needs based on customer demand, leading to less over-ordering and less food waste to support sustainability initiatives. One company in this space, FourKites, is creating what it calls “the digital supply chain of the future.” Using real-time visibility and machine learning, FourKites powers and optimizes global supply chains, making them “automated, interconnected and collaborative—spanning transportation, warehouses, stores, trucks and more.”

In addition to predictive planning, more and more brands will start to use AI to create incident risk management models to identify trends and risks in the supply chain to determine whether bad or recalled products are originating from a specific supplier, distributor, or due to an environmental variable.With all of these changes, the need for comprehensive data standards will multiply as suppliers and distributors around the world work together to bring us produce and packaged food from all corners of the globe. Data standards will be critical to traceability and the exchange of critical tracking events and key data elements, and advances in data standards will power the meta-data needed to provide better insight for food quality and regulatory compliance, crisis management, and recalls—at scale.

Research firm Forrester states that, in the end, the greatest impact resulting from an investment in robotics and other technologies that automate operational tasks is improved customer experience (CX). “Most companies believe that investment in AI, automation, and robotics for engagement will decrease operational costs. While this is true, our research shows that the revenue upside from delivering better CX could deliver a greater impact on the bottom line over time,” Forrester states.

As a business engaged in digitizing and transforming supply chain operations, our team couldn’t agree with Forrester more. But we believe it will take striking the right balance between technology and the human touch to not only drive stronger CX, but to also create a world in which AI is implemented for the greater good—a world in which people, processes, business and technology all win.

Julie Holt, Decernis
FST Soapbox

California Proposition 65: Every Company Should Know Their Risk

By Julie Holt
No Comments
Julie Holt, Decernis

Known officially as The California Safe Drinking Water and Toxic Enforcement Act of 1986, California Proposition 65 reaches far beyond state boundaries and has potential regulatory implications for almost any company that manufactures, imports, and / or sells products containing listed chemicals in the state. California Prop 65 prohibits the sale of a product in California that knowingly and intentionally exposes an individual to a California Office of Environmental Health Hazard Assessment (OEHHA) listed chemical without a specific stated warning. For many food and supplement companies, the risk of opportunistic litigation based on California Prop 65 drives the need to monitor updates, new amendments and enforcement of the law.

Prop 65 Background

California Proposition 65, also known by the shortened name Prop 65, is not a ban on products or ingredients. The law is intended to inform consumers in California about exposure to a list of chemicals exceeding a defined level in products for sale, including product packaging. The regulation mandates a warning label for exposure to chemicals at a level that could cause cancer, birth defects or other reproductive harm. Guidance for upper limits (“Safe Harbor Level”) on chemicals is based on expected daily exposure. If no Safe Harbor Level exists for a chemical, the product containing a listed chemical must include a warning, unless the exposure level can be proven to not pose a significant risk of causing harm.

With the size of the California economy and the interconnected U.S. supply chain, the state law effectively reaches other states and U.S. importers. More recently, the Prop 65 requirements impact online and catalog sales, which have increased significantly during the global pandemic.

Know Your Suppliers

All companies need to proactively evaluate and document Prop 65 risks. Enforcement occurs primarily through civil litigation, resulting in specialized legal firms profiting from a company’s ignorance of the law’s extent. Even the threat of publicity from a lawsuit can cause targeted companies to settle a case.
At each point of manufacturing and distribution—supplier, manufacturer, packager, importer or distributor—regulatory teams should ask about Prop 65 compliance. The main point of responsibility is at the manufacturer, but a retailer can also be obligated for introducing a chemical at point-of-sale.

What’s New with Prop 65

The OEHHA issues notices regarding amendments to the California Code of Regulations Title 27, Article 6, covering “Clear and Reasonable Warnings”. Recently the OEHHA requested public comments on proposed amendments that would modify the content and methods for providing “short-form” warnings. The short form was originally intended for products with restricted label space.

The proposed rule would modify the existing short-form warning provisions to:

  • Only allow use of the short-form warning on products with five square inches or less of label space.
  • Eliminate use of short-form warnings for products sold via the Internet and catalogs.
  • Clarify how short-form warnings can be used for food products.
  • Require the name of at least one chemical be included in the short-form warning.

Bottomline: Know Your Business and Risk

As an advisor with more than 20 years of regulatory compliance experience in food and food ingredients, my guidance for business best practice on Prop 65 is to be proactive, maintain supply chain knowledge, and understand risk. Regulatory or legal staff, or consultant teams specializing in Prop 65, should regularly monitor for additions to the chemical list and rulemaking changes to the far-reaching law.

Susanne Kuehne, Decernis
Food Fraud Quick Bites

Embrace Those Curves

By Susanne Kuehne
No Comments
Susanne Kuehne, Decernis
Near infrared spectroscopy
Find records of fraud such as those discussed in this column and more in the Food Fraud Database, owned and operated by Decernis, a Food Safety Tech advertiser. Image credit: Susanne Kuehne

Lab methods for the analysis of adulterated food can be time-consuming, expensive and impossible to use in the field. A new study shows promising results for hand-held near infrared (NIR) spectroscopy tools. The investigated method proved to be very quick and highly accurate, and could open new possibilities for remote testing. This was shown in a study with oregano samples, a common target for food adulteration.


Resource

  1. Mc Grath, T.F., et al. (to be published on August 15, 2021) “The potential of handheld near infrared spectroscopy to detect food adulteration: Results of a global, multi-instrument inter-laboratory study”. Abstract. Science Direct.
Laura Gutierrez Becerra
Women in Food Safety

We Asked, You Answered: The Voice of Women In Food Safety

By Laura Gutierrez Becerra
1 Comment
Laura Gutierrez Becerra

In an effort to continue supporting female professionals contributing to the food safety industry and better understand their feelings and experiences while going through different stages in their career, we released our first survey in September 2020. The results will help us provide better resources to address the challenges and barriers reported from the survey.

Women in Food Safety
Figure 1. (click to enlarge)

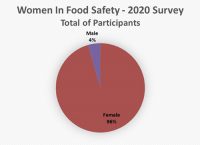
The participation received from the leaders in food safety who completed the survey was significant. We were humbled and excited to notice that within a couple of weeks of launching the survey, 201 responses were received from 19 different countries. Although the survey was intended to assess the situations and experiences women are going through or have gone through, responses from their counterparts, male leaders, were also received. Ninety six percent of the responses are from females. (see Figure 1).

The key survey results were shared and discussed during the “We Asked, You Answered- The Voice of Women In Food Safety” panel session (view complimentary webinar recording) at the Food Safety Consortium Virtual Conference Series on November 5. The following are the insights we gained from the responses.

Position Levels Percentage (%)
Senior executive 14.9
Management 61.7
Administrative/Entry level 6.5
Other (Students) 1.5
Other (CEO) 0.5
Other (Research, consulting, auditor, trainer, regulatory) 14.9
Table 1. Responses by Position Levels

The survey participants hold positions at all professional levels and years within an organization. 61.7% of the total responses are linked to management levels, but only 14.9% are Senior Executive Level (see Table 1). Years of experience were broken down into five categories (see Table 2); 68.2% of the respondents had more than eight years of experience.

Years of Experience Percentage (%)
15+ 38.8
8–15 29.4
5–8 11.9
2–5 13.4
0–2 6.5
Table 2. Responses by Years of Experience

Well-rounded questions were provided in the survey, including situational inquiries, career advancement and the obstacles presented when entering the job market. In addition, opinion-based questions were formulated to understand how extensive networking is leveraged as a developmental and career advancement tool; it also addressed some of the expectations hiring managers have when hiring talent versus what the expectations professionals had when looking for their first jobs. Last but not least, a set of experience-based questions related to the encountered barriers found throughout the career journey, what is attributed to career success, the importance of diversity, and what are the career pivot points when life and career changes come up, were also presented.

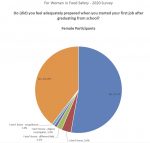
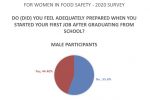
With regards to preparedness after graduating from educational training and starting a first job, similar responses were provided between females and males. Women provided three different responses: 54.2% felt they were/are not adequately prepared; 40.6% feel were/are well-prepared; and 7.7% of women did not know their level of preparation; this can be attributed to no guidance received to better navigate the transition from school to the workforce and not being able to completion an educational degree (see Figure 2). Similar to women, 55.6% of men feel they were not adequately prepared; however, the remainder of male responses (44.4%) did not find any issues with the transition to their first job from school (See Figure 3).

Respondents weigh in on feeling adequate prepared when starting their first job after graduating from school. Respondents weigh in on feeling adequate prepared when starting their first job after graduating from school. Figure 4. Obstacles presented when entering the job market. Understanding the Importance of networking (female participants).
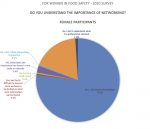
Figure 2 and 3. Respondents weigh in on feeling adequate prepared when starting their first job after graduating from school. (Click to enlarge all images) Figure 4. Obstacles presented when entering the job market. Figure 5. Understanding the Importance of networking (female participants).

The experience all participants shared regarding the obstacles presented when entering the job market revealed that, in general, 52.7% of the participants find a lack of connection with a company-experienced employee is the primary obstacle, 49.3% associate the obstacle to lack of connection to industry while attending school, and nearly 30% of participants indicate that they are lacking credentials to meet the job requirements (i.e., not having enough experience for required certifications). In this question, there two additional responses were reported: 15.4% of women did/do not know where to start and 4.5% did/do not know what qualifications the industry is looking for (See Figure 4).

The highlight between female and male responses for this question is the lack of credentials to meet the job requirements as an obstacle to a successful job initiation. In this case, a higher percentage of men (44%) reported this issue as an obstacle compared to the responses submitted by women (29%).

In terms of understanding the importance of networking, 76% of women confirm that they know how to master the skill of networking, but nearly 18% do not know how to start building their network. Additionally, there were a couple of responses from females confirming their understanding of the importance of networking; however, it is only to some extent and they have difficulty connecting with others due to the skill not coming naturally or having some limitations in terms of information sharing (see Figure 5). Only 1% of female responses reported not understanding exactly what a professional network is; whereas 100% of male respondents indicate no issues with understanding the important of networking.

When it comes to the topic of diversity and its importance within a company, 83.3% of female participants said diversity is important to them. Detailed responses are in Table 3.

Is Diversity within a Company Important to You?
11% Not important
9% Do not know
2% Do not know/Would not weigh diversity higher than finding the right candidate
Table 3. Percentages taken out of 192 female responses.

For females, significant career barriers did not fall under a single-specific category. The responses submitted identify 13 different barriers where work/life demands (41%), feeling of the glass ceiling (41%) and education/degree (5%) are found to have a greater concern among others, including students (see Figure 6.). Other barriers, such as soft skills, lack of support from management and lack of opportunity near family are categories that were mostly reported from women holding management level positions (see Figure 7.)

Figure 6. Most significant career barriers.
Figure 6. The most significant career barriers. Figure 7. The most significant career barrier among all level positions among female participants.

In the case of men, work/life demands are recognized as the career barrier of most concern among senior executives (56%). In addition , only other two reasons are reported as barriers: The feeling of a glass ceiling (reported by senior executive level and administrative/entry level) and diversity (reported by management level position) (see Figure 8).

Figure 8. Most significant career barriers among male participants. Figure 9. Career success attribution as defined by female participants. Figure 10. Career success attribution as defined by participants. Figure 11. Life and career changing concerns among female participants.

Regarding the contributors to career success, self-learning/motivation is the leading category. This is followed by job experience and working with a mentor (see Figures 9 and 10). The main difference between women and men regarding their career success is educational degree, and being persistent and having patience. In this case, female responses outlined that being persistent and having patience is a success factor.

Life and career changes cause stress and disharmony in a person’s life, requiring a modification in job performance and handling of personal responsibility. The concern between men and women differs considerably. While men are more concerned about job reassignments/promotions, extensive traveling, and relocation; women reported they have 11 additional reasons to be concerned. Motherhood or taking care of dependents are the leading issues. (see Figure 11).

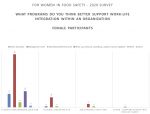
The survey also included inputs on what programs would better support the integration of work and life harmony within an organization. Flexible time/working location is found as the primary need from female responses in all position levels. Then, flexible/unlimited personal time off is the second identified need submitted in their responses. In addition, women in management level positions were the demographic responding to all four provided responses. This was contrary to senior executive women who found flexible time/working location as the only category to better support work integration and life harmony (see Figure 12). In the case of men, only two responses provide insight as to their need for support; 88.9% of them would like to have more flexible time/working location and 11.1% consider being part of the workload allocation process beneficial.

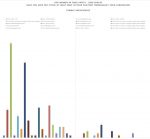
From all responses received, about 90% have felt stuck at least once in their position throughout their career or job. Females in management level positions with working experience of eight years or more lead the number of responses (see Figure 13). There is a higher percentage of males (22%) who have not felt stuck in their career compared to the response submitted by females (10%). Male senior executives with more than 15 years of experience have the higher number of responses (see Figure 14).

Figure 12. Better support for the integration of work and life harmony within an organization (female participants). Figure 13. Felt stuck at least once in their position throughout their career/job (female participants). Figure 14. Felt stuck at least once in their position throughout their career/job (male participants).

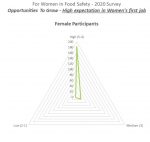
The survey also included ranking questions to understand what the expectations were/are among the participants related to their first job. Table 4 outlines the five expectations the participants chose from when answering this question, highlighting that 183 out of 201 participants place opportunities to grow at the highest level of importance. Social networking rated the lowest (81 out of 201) in importance among the total responses received.In term of gender-specific answers, both women and men identified opportunities to grow as the expectation with highest level of importance. For women, the expectation with lowest level of importance is social networking; for men, competitive salaries, and opportunities to use what you learned from school are the not-so important expectations (see Figures 15, 16, 17 and 18).

Figure 15. Importance of expectation on the first job (female participants). Figure 16. Opportunities to grow (female participants). Figure 17. Figure 18.
Figure 15. Importance of expectation on the first job (female participants). Figure 16. Opportunities to grow (female participants). Figure 17 and 18. Male participants

The expectation from participants regarding what is the level of importance when hiring new graduate employees highlights “complete the tasks as instructed” as the highest expectation among the 201 participants and experience through internships as the lowest level of importance (see Table 5).

In addition to the five options for answers, women also included three additional expectations:

  • Understanding of company culture and when is a good time to look for a new opportunity
  • Ability to solve problems, analytical thinking and get results independently
  • Learning mindset

Conclusions

Responses from 19 different countries were received from the survey with 96% being from females. Among all position levels provided their inputs, but the largest participation was from women holding management level positions (62%). With regards to the categories on years of experience, those with more than 15 years of experience had the higher percentage of participation (39%), but only 15% were senior executives.

Some key preliminary outcomes are reported as follows:

  • Self-learning and motivation are two leading drivers for career success.
  • Work/life demands and feeling of a glass ceiling are identified as the main career barrier among women and men. Educational degree is a reported concern specific to women and diversity is specific to men.
  • There are no significant differences between females and males regarding not feeling adequately prepared when starting the first job (52.4% – female; 55.6% – male).
  • 52.7% of all participants find a lack of connection with a company-experienced employee as the main obstacle when entering the job market. Lack of credentials is a significant obstacle for males (44.4%) vs. females (29.2%).
  • 100% of male responses said they mastered the skill of networking vs. 76% from female responses.
  • There are no significant differences between females and males regarding not having any issues when transitioning to their first job after graduating from school (41% – female; 44% – male). However, 7.7% of women do not know if they were/are prepared.
  • Flexible time/working location named as the primary need as people believe it would better to support integration of work and life harmony among all position levels.
  • 90% of participants felt stuck at least once in their position throughout their career or job. A higher percentage of men (22%) confirmed not feeling stuck in their career compared with the responses submitted by women (10%).
  • All responses identified opportunities to grow as the expectation with highest level of importance when first starting a career. For females, the expectation with lowest level of importance is social networking. For men, competitive salaries and opportunities to use what they learned in school are not important expectations.
  • The expectation among the 201 participants on what is important when hiring newly graduated employee report completing the tasks as instructed as the highest expectation and placed experience through internships as the lowest level of importance.
Susanne Kuehne, Decernis
Food Fraud Quick Bites

Olive Oil Detectives in the Lab

By Susanne Kuehne
No Comments
Susanne Kuehne, Decernis
Olive tree, food fraud
Find records of fraud such as those discussed in this column and more in the Food Fraud Database, owned and operated by Decernis, an advertiser in Food Safety Tech. Image credit: Susanne Kuehne

Canola oil, sunflower oil or soybean oil, colorants and low-quality olive oil, anyone? Olive oil, especially extra virgin olive oil adulteration is rampant, since the risk of getting caught is low and the profits are huge. A new expert-reviewed Laboratory Guidance Document on olive oil, published by the Botanical Adulterants Prevention Program (BAPP), lists a variety of laboratory methods at different levels of complexity, as well as the most common methods of adulteration. This Laboratory Guidance Document is an indispensable guide for regulatory and research personnel in the food, supplement and cosmetics industries.

Resource

  1. Mailer, R.J. and Gafner, S. (March 2021). “Botanical Adulterants Prevention Program Publishes Olive Oil Laboratory Guidance Document”. Botanical Adulterant Prevention Program.
Roberto Bellavia, Kestrel
FST Soapbox

How Integrated Compliance Management Systems Maximize Efficiency

By Roberto Bellavia
No Comments
Roberto Bellavia, Kestrel

Managing the complexities of a management system is challenging for any food and beverage company, particularly for the team tasked with implementing the system throughout the organization. That is because every regulatory agency (e.g., FDA, USDA, OSHA, EPA) and voluntary certification (e.g., GFSI-benchmarked standards, gluten-free, organic, ISO) calls for companies to fulfill compliance requirements—many of which overlap. Supply chain and internal requirements can create further complications and confusion.

In today’s “New Era of Smarter Food Safety,” having a common system to organize, manage and track compliance offers an ideal solution. Dynamic tools are becoming available—systems that can manage employee training, pest control, laboratory testing, supply chain management tools, regulatory compliance and certification requirements, etc.

Unfortunately, these systems are often not set up to “talk” to each other, leaving company representatives to navigate many systems, databases, folders, and documents housed in many different locations.

The Solution: Compliance Management Systems

An integrated compliance management system (CMS) is intended to bring all these tools together to create one system that effectively manages compliance requirements, enables staff to carry out daily tasks and manage operations, and supports operational decision making by tracking and trending data that is collected daily by the team charged with implementation.

A CMS is used to coordinate, organize, control, analyze and visualize information to help organizations remain in compliance and operate efficiently. A successful CMS thinks beyond just access to documents; it manages the processes, knowledge and work that is critical to helping identify and control business risks. That may include the following:

  • Ensuring only authorized employees can access the right information.
  • Consolidating documents and records in a centralized location to provide easy access
  • Setting up formal business practices, processes and procedures
  • Implementing compliance and certification programs
  • Monitoring and measuring performance
  • Supporting continuous improvements
  • Documenting decisions and how they are made
  • Capturing institutional knowledge and transferring that into a sustainable system
  • Using task management and tracking tools to understand how people are doing their work
  • Enabling data trending and predictive analytics

CMS Case Study: Boston Sword and Tuna

In early 2019, Boston Sword and Tuna (BST) began the process of achieving SQF food safety certification. We initially started working with BST on the development, training and implementation of the program requirements to the SQF code for certification—including developing guidance documents for a new site under construction.

The process of attaining SQF certification included the development of a register of SQF requirements in Microsoft SharePoint, which has since evolved into a more comprehensive approach to overall data and compliance management. “We didn’t plan to build a paperless food safety management system,” explains BST President Larry Dore, “until we implemented our SQF food safety management program and realized that we needed a better way to manage data.”

We worked with BST to structure the company’s SharePoint CMS according to existing BST food safety management processes to support its certification requirements and overall food safety management program. This has included developing a number of modules/tools to support ongoing compliance efforts and providing online/remote training in the management of the site and a paperless data collection module.

The BST CMS has been designed to support daily task activities with reminders and specific workflows that ensure proper records verifications are carried out as required. The system houses tools and forms, standards/regulatory registers, and calendars for tracking action items, including the following:

  • Ambient Temperature
  • Corrective and Preventive Action (CAPA)
  • Chemical Inventory/Safety Data Sheets (SDS)
  • Compliance Management
  • Customer Complaints
  • Document Control
  • Employee Health Check
  • Food Safety Meetings Management Program
  • Forklift Inspections
  • Good Manufacturing Practices (GMP) Audit
  • SQF Register
  • Maintenance (requests/work orders/assets/repairs)
  • Nightly Cleaning Inspections
  • Operational/Pre-Operational Inspections
  • Sanitation Pre-Op Inspections
  • Scale Calibration
  • Sharp/Knife Inspections
  • Shipping/Receiving Logs
  • Thawing Temperature Log
  • Thermometer Calibration

Key Considerations for Designing a Successful CMS

An effective CMS requires an understanding of technology, operational needs, regulatory compliance obligations and certification requirements, as well as the bigger picture of the company’s overall strategy. There are several key considerations that can help ensure companies end up with the right CMS and efficiency tools to provide an integrated system that supports the organization for the long term.

Before design can even begin, it is important to first determine where you are starting by conducting an inventory of existing systems. This includes not only identifying how you are currently managing your compliance and certification requirements, but also assessing how well those current systems (or parts of them) are working for the organization.

As with many projects, design should begin with the end in mind. What are the business drivers that are guiding your system? What are the outcomes you want to achieve through your system (e.g., create efficiencies, provide remote access, reduce duplication of effort, produce real-time reports, respond to regulatory requirements, foster teamwork and communication)? Assuming that managing compliance and certification requirements is a fundamental objective of the CMS, having a solid understanding of those requirements is key to building the system. These requirements should be documented so they can be built into the CMS for efficient tracking and management.

While you may not build everything from the start, defining the ultimate desired end state will allow for development to proceed so every module is aligned under the CMS. Understand that building a CMS is a process, and different organizations will be comfortable with different paces and budgets. Establish priorities (i.e., the most important items on your list), schedule and budget. Doing so will allow you to determine whether to tackle the full system at once or develop one module at a time. For many, it makes sense to start with existing processes that work well and transition those first. Priorities should be set based on ease of implementation, compliance risk, business improvement and value to the company.

Finally, the CMS will not work well without getting the right people involved—and that can include many different people at various points in the process (e.g., end user entering data in the plant, management reviewing reports and metrics, system administrator, office staff). The system should be designed to reflect the daily routines of those employees who will be using it. Modules should build off existing routines, tasks, and activities to create familiarity and encourage adoption. A truly user-friendly system will be something that meets the needs of all parties.

Driving Value and Compliance Efficiency

When thoughtfully designed, a CMS can provide significant value by creating compliance efficiencies that improve the company’s ability to create consistent and reliable compliance performance. “Our system is allowing us to actually use data analytics for decision making and continuous opportunity,” said Dore. “Plus, it is making remote activities much more practical and efficient”.

For BST, the CMS also:

  • Provides central management of inspection schedules, forms, and other requirements.
  • Increases productivity through reductions in prep time and redundant/manual data entry.
  • Improves data access/availability for reporting and planning purposes.
  • Effectively monitors operational activities to ensure compliance and certifications standards are met.
  • Allows data to be submitted directly and immediately into SharePoint so it can be reviewed, analyzed, etc. in real time.
  • Creates workflow and process automation, including automated notifications to allow for real-time improvements.
  • Allows follow-up actions to be assigned and sent to those who need them.

All these things work together to help the company reduce compliance risk, create efficiencies, provide operational flexibility, and generate business improvement and value.

Susanne Kuehne, Decernis
Food Fraud Quick Bites

Pulling The Plug (Cork) On Wine Fraud

By Susanne Kuehne
No Comments
Susanne Kuehne, Decernis
Wine fraud, Cork, Ireland
Find records of fraud such as those discussed in this column and more in the Food Fraud Database. Image credit: Susanne Kuehne

Tax officials in the Irish city of Cork seized almost 25,000 liters of counterfeit wine, the equivalent of 33,000 bottles. The wine is valued at more than $360,000, which also results in a significant loss in alcohol tax revenue. Investigators are looking into whether this is the largest seizure of counterfeit wine in the past five years. The container passed through the terminal in Cork from the Netherlands and was discovered during an official operation that targets illicit alcohol sales.

Resources

  1. Besser, R. (March 23, 2021). “Ireland confiscates illegal wine, but loses $192,000 in alcohol taxes”. Dublin News.
  2. O’Loughlin, C. (March 18, 2021). “Counterfeit wine worth over €300k seized in Cork”. Irish Independent.
Stephen Dombroski, QAD
FST Soapbox

Regulatory Issues and Transportation: Critical Factors in the Quest for Sustainability in Food Manufacturing

By Stephen Dombroski
No Comments
Stephen Dombroski, QAD

Over the last several months, we have been exploring the details of several critical factors that are impacting the food and beverage manufacturing sector in terms of sustainability, including:

Two additional factors that food manufacturers now have to manage regarding sustainable practices are transportation and regulatory restrictions. Each can be discussed as a separate topic, but they are intertwined, as there have always been regulations regarding food transportation, and obviously food has always needed to be transported. Now that sustainability is an important topic in all areas of food manufacturing, it makes sense to discuss these two subjects both individually and collectively.

Transportation and Regulatory Joint Concerns

Ensuring that all areas of food transportation incorporate sustainable practices is a critical component of achieving sustainability in food manufacturing. To this point, however, these types of practices have not fully been implemented or even designed. This area is still evolving. From a straight transportation point of view, governments globally have been imposing restrictions for decades. These restrictions vary from country to country, province to province, region to region, and so on, and this causes confusion when inter- or intra-region transportation of food is required. There are also several regulatory differences based on mode of transportation. Land, air and sea transportation can and should have different regulations.

Another ingredient that should be added to this product mix of sustainability, transportation and regulations is food safety and the integrity of the food materials being transported whether it is ingredients, work-in-process foods or finished products. Various modes of transportation can affect the chemical composition, physical appearance, nutritional value and quality and safety of food. It could be straightforward to start implementing restrictions, regulations and new methods of how to package, manufacture and transport food to satisfy the growing trend of sustainable food behaviors. However, what cannot get lost in this is the issue of food safety and integrity.

Sustainability More than Recycling and Litter

When discussing regulations around transportation and food, many people immediately think of littering, of some uncaring individual throwing a soda pop can out of a car window. Littering regulations, laws, fines, penalties and public service campaigns have been in place globally for more than 50 years. The next time you go outside, take a look around at how effective those have been. Sustainability goes far beyond the issue of litter. One area that works hand in hand with transportation of food is climate change. Governments have been evaluating the current practices and have begun implementing changes designed to positively affect climate change. Some examples include:

  • 23 American states and Washington, D.C. limit idling by some or all vehicles.
  • The California Air Resources Board adopted the TRU Airborne Toxic Control Measure in 2004 to reduce diesel particulate matter pollutant emissions.
  • In 2020, the International Maritime Organization will implement a new regulation for a 0.50% global sulfur cap for marine fuels.

The food and beverage industry is actively embracing other changes that affect sustainability. Electric trucks fit well with the F&B distribution hub model, with clean, quiet, short-run deliveries. Fuel usage during transportation is being considered from every angle. Local and regional food systems, where farmers and processors sell and distribute their food to consumers within a given area, use less fossil fuel for transportation because the distance from farm to consumer is shorter. This shorter distance also can help to reduce CO2 emissions.

Change Starts with Money

During many conversations I have had with my wife about a variety of subjects, especially those that can be considered controversial, one of us always raises the same question which is: “When in doubt, what is it all about?” And most of the time, the answer is money. Regulations around sustainability in food manufacturing are being driven by demands made by the consumer. The purchasers of the finished food product dictate almost every aspect of that product to the manufacturer because, let’s face it, if the consumer doesn’t like it, they won’t buy it. And if they don’t buy it, what will eventually happen to the manufacturer? That’s right—it goes out of business.

Now there is a good definition of sustainability or at least of what is not sustainable. From the transportation side of things, manufacturers in almost all cases pay the freight of shipping their food products to the members of the value chain. This obviously affects the costs of goods sold, which is a direct component of the bottom line and the profitability of the business. And with margins typically low in food and beverage manufacturing, transportation costs are always on the minds of the executives. So as the drive for sustainable transportation practices rolls into food manufacturing, you can bet that in addition to meeting sustainable practices, they will fit into the financial plans of the organization as well.

Sustainability: Just Another Component in a Long Line of Disruptors in Food Manufacturing

Years ago, when the topic of disruption in food manufacturing came up, many would mention things like a customer changing an order, an ingredient not arriving on time, or a packaging line going down for an hour. Today, these occurrences are just part of the day-to-day process and reality of food manufacturing. They are going to happen, and disruptions are the things that will make a food manufacturer have to change their business model and force them to change their philosophy and begin to evaluate their business practices and systems to adjust to the world in which they operate.

Sustainability is another one of those disruptions that will impact the process of food transportation long term. Sustainability will be an area that eventually forces manufacturers to operate within new regulatory parameters imposed on how they produce and ship their food. Through these changes, manufacturers will have to ensure that food meets the current and future safety regulations while maintaining profitability. That is where real sustainability will be measured. Changes to business, movements like sustainability are adding to the disruption of the food industry at unprecedented rates of speed. In order to survive and thrive, and to meet these disruptions head on and be sustainable themselves, global food manufacturers must be able to innovate and adapt their business models.

Susanne Kuehne, Decernis
Food Fraud Quick Bites

Don’t Let The Cat(fish) Out Of The Bag

By Susanne Kuehne
No Comments
Susanne Kuehne, Decernis
Catfish, food fraud
Find records of fraud such as those discussed in this column and more in the Food Fraud Database. Image credit: Susanne Kuehne

A multinational criminal smuggling ring was involved in the import of mislabeled siluriformes fish, including several species of catfish, into the United States. Import of such fish is prohibited to ensure the safety of the food supply in the United States. The smuggled catfish was labeled and listed on the import paperwork as other types of fish, which was discovered during a customs inspection. Subsequent seizures of shipping containers and warehouses led to the discovery of large amounts of mislabeled fish. The defendants face steep prison sentences.

Resources

  1. White, C. (February 22, 2021). “Catfish smuggling ring busted in New York City”. Seafood Source.
  2. “Four Alleged Smugglers Charged For Importing Banned Catfish Into The United States”. (February 18, 2021). U.S. Department of Justice. U.S. Attorney’s Southern District of New York.
Olga Pawluczyk, P&P Optica
FST Soapbox

Assessing Detection Systems to Make Food Safer

By Olga Pawluczyk
No Comments
Olga Pawluczyk, P&P Optica

It is an exciting time to be in the food industry. Consumers are ever more aware of what they are eating and more demanding of quality. And the vital need to reduce global food waste is transforming how we produce and consume food. This is driving innovation all the way along the supply chain, from gate to plate.

One of the biggest areas of opportunity for the industry to increase automation and improve food safety is in the processing plant. The challenges processors have faced in the last 12 months have accelerated the focus on optimizing resources and the drive for more adoption of new technology.

Foreign material contamination is a growing issue in the meat industry and new types of detection systems are emerging to help address this challenge. As Casey Gallimore, director of regulatory and scientific affairs at the North American Meat Institute, highlighted in a recent webinar, 2019 was a record year for the number of recalls related to foreign object contamination, which totaled 27% of all FSIS recalls in that year.

“There are a number of potential reasons why recalls due to foreign object contamination have increased over the years: Greater regulatory focus, more discerning consumers, [and] more automation in plants. But one important reason for this trend is that we have a lot of new technology to help detect more, [but] we are not necessarily using it to its full potential,” said Gallimore. “As an industry, we have a strong track record of working together to provide industry-wide solutions to industry-wide problems. And I believe that education is key to understanding how different detection systems—often used together—can increase the safety and quality of our food.”

Types of Detection Systems

Processors use many different detection systems to find foreign materials in their products. Equipment such as x-rays and metal detectors, which have been used for many years, are not effective against many of today’s contaminants: Plastics, rubber, cardboard and glass. And even the most well trained inspectors are affected by fatigue, distraction, discomfort and many other factors. A multi-hurdle approach is imperative, and new technologies like vision systems need to be considered.

Vision systems, such as cameras, multi-spectral, and hyperspectral imaging systems can find objects, such as low-density plastics, that may have been missed by other detection methods. Yet, depending on the system, their performance and capabilities can vary widely.

Camera-based systems are the most similar to the human eye. These systems are good for distinguishing objects of varying size and shape, albeit in two-dimensions rather than three. But they become less effective in situations with low contrast between the background and the object being detected. Clear plastics are a good example of this.

Multi-spectral systems are able to see more colors, including wavelengths outside of the visible spectrum. However, multispectral systems are set up to use only specific wavelengths, which are selected based on the materials that the system is expected to detect. That means that multispectral systems can identify some chemical as well as visual properties of materials, based on those specific wavelengths. It also means that other materials, which the system has not been designed to find, will likely not be detected by a multispectral system.

Another relatively new type of vision system uses hyperspectral imaging. These systems use chemistry to detect differences in the materials being inspected and therefore recognize a broad range of different contaminants. They are especially good at seeing objects that cameras or human inspectors may miss and at identifying the specific contaminant that’s been detected. The same system can assess quality metrics such as composition and identify product flaws such as woody breast in chicken. Hyperspectral systems also gather tremendous amounts of chemistry data about the products they are monitoring and can use artificial intelligence and machine learning to get a more holistic picture of what is happening in the plant over time, and how to prevent future contamination issues. This might include identifying issues with a specific supplier, training or other process challenges on one line (or in one shift), or machinery in the plant that is causing ongoing contamination problems.

Many processors are considering implementing new inspection systems, and are struggling to understand how to compare the expected performance of different systems. One relatively simple methodology that can be used to evaluate system performance is, despite its simplicity, called a “Confusion Matrix”.

The Confusion Matrix

A confusion matrix is often used in machine learning. It compares the expected outcome of an event with the actual outcome in order to understand the reliability of a test.

Figure 1 shows four possible outcomes for any kind of test.

Actual (True Condition)

Predicted

(Measured Outcome)

Positive (P) Negative (N)
Positive Detection True Positives (TP) False Positives (FP)
Negative Detection False Negatives (FN) True Negatives (TN)
P = TP + FN N = FP + TN
Figure 1. Confusion Matrix

But what does a confusion matrix tell us, and how can it help us assess a detection system?

The matrix shows us that a detection system may incorrectly register a positive or negative detection event—known as a ‘False Positive’ or ‘False Negative’.

As an example, say we are testing for a disease such as COVID-19. We want to know how often our system will give us a True Positive (detecting COVID when it *IS* present) versus a False Positive (detecting COVID when it *IS NOT* present).

Let’s apply this to processing. If you are using an x-ray to detect foreign objects, a small piece of plastic or wood would pass through unnoticed. This is a False Negative. By contrast, a system that uses hyperspectral imaging would easily identify that same piece of plastic or wood, because it has a different chemical signature from the product you’re processing. This is a True Positive.

A high rate of false negatives—failing to identify existing foreign materials—can mean contaminated product ends up in the hands of consumers.

The other side of the coin is false positives, meaning that the detector believes foreign material to be present when in fact it is not. A high rate of False Positives can lead to significant and unnecessary product wastage, or in time lost investigating an incident that didn’t actually occur (see Figure 2).

True Positives and False Positives
Figure 2. Balance of True Positives and False Positives

The secret to a good detection system lies in carefully balancing the rates of true positives and false positives by adjusting the sensitivity of a system.

This is where testing comes in. By adjusting a system and testing under different conditions, and then plotting these outcomes on the confusion matrix, you get an accurate picture of the system’s performance.

Effectiveness of a Detector

Detection is not just the act of seeing. It is the act of making a decision based on what you have seen, by understanding whether something of importance has occurred. Many factors influence the effectiveness of any detection system.

Resolution. This is the smallest size of object that can possibly be detected. For example, when you look at a photograph, the resolution affects how closely you can zoom in on an image before it becomes blurry.

Signal to noise ratio. This measures the electronic “noise” of the detector and compares it with the “background noise” that may interfere with the signals received by the detector. Too much background noise makes it harder to identify a foreign object.

Speed of acquisition. This measures how fast the detector can process the signals it receives. Motion limits what you can see. As line speeds increase, this impacts what detectors are able to pick up.

Material being detected. The type of material being detected and its properties will have a significant impact on the likelihood of detection. As previously mentioned, for example, x-rays are unlikely to detect low-density materials such as cardboard, resulting in a high number of False Negatives.

Presentation or location of material being detected. Materials that are underneath another object, that are presented on an angle, are too similar to the product being inspected, or are partially obstructed may be more difficult for some detectors to find. This also presents a risk of False Negatives.

Complexity of the product under inspection. Product composition and appearance vary. For example, just like the human eye, finding a small object on a uniformly illuminated and uniform color background like a white kitchen floor is much easier than finding the same small object on a complex background like industrial carpet. Coarsely ground meat might be more difficult to detect than uniform back fat layers, for example.

Environment. Conditions such as temperature and humidity will have a significant effect on detection.

Detection Curves

To understand system performance even better, we can use a detection curve. This plots out the likelihood of detection against different variables (e.g., object size) and allows us to objectively compare how these different factors impact the performance of each system.

Figure 3 shows how this looks when plotted as a curve, with object size on the x-axis (horizontal) and the probability of detection (a True Positive from the Confusion Matrix) on the y-axis (vertical). It shows three examples of possible detection curves, depending on the detector being used.

Detection curves
Figure 3. Examples of detection curves for different detectors. Probability of detection of an object increases as the size of the object increases.

A detection curve tells you both the smallest and largest object that a detector will find and the probability that it will be found.

In the example presented by Figure 3, Detector 3 can see essentially 100% of large and very large objects, as can Detector 2. But Detector 3 is also more likely than the other two systems in the example to see microscopic objects. Based on this detection curve it would likely be the best option if the goal were to detect as many foreign objects as possible, of all sizes.

Of course, the performance of a detector is determined by multiple measures, not just size,

Detection capability can be improved for most detection systems, but typically comes at a significant cost: Increasing sensitivity will increase the number of false positives, resulting in increased product rejection. This is why looking at the detection curve together with the false-positive/false-negative rates for any detection system gives us a clear picture of its performance and is invaluable for food processing plants when selecting a system.

Using the confusion matrix and a detection curve, processors can compare different detection systems on an apples-to-apples basis. They can easily see whether a system can identify small, tiny or microscopic objects and, crucially, how often it will identify them.

Every detection method—X -ray, metal detection, vision systems, manual inspection—presents a trade-off between actual (correct) detection, rejection of good product (false positive) and missed detections (false negative). This simple way to compare differences means processors can make the right decision for the specific needs of their plant, based on easily gathered information. For all of us data geeks out there, that sounds like the Holy Grail.