Dollar

Quantifying the ROI of Environmental Monitoring Program Automation

By Joseph Heinzelmann
No Comments
Dollar

The COVID-19 pandemic heightened the urgency for food brands to adopt technology solutions that support remote management of environmental monitoring programs (EMPs) as they strive to provide safe products to customers. While digital transformation has progressed within the food safety industry, food and beverage manufacturers often have lower profitability as compared to other manufacturing industries, such as pharmaceutical and high-tech equipment, which can lead to smaller IT spend.1 Many companies still rely on manual processes for environmental monitoring and reporting, which are prone to error, fail to provide organizations with visibility into all of their facilities and limit the ability to quickly take corrective actions.

Despite growing recognition of the value of automating testing, diagnostics, corrective actions and analytic workflows to prevent contamination issues in food production environments, barriers to adoption persist. One key obstacle is the recurring mindset that food safety is a necessary compliance cost. Instead, we need to recognize that EMP workflow automation can create real business value. While the downside of food safety issues is easy to quantify, organizations still struggle to understand the upside, such as positive contributions to productivity and a stronger bottom-line achieved by automating certain food safety processes.

To understand how organizations are using workflow automation and analytics to drive quantifiable business ROI, a two-year study that included interviews and anonymized data collection with food safety, operations, and executive leadership at 34 food organizations was conducted.

The respondents represent more than 120 facilities using advanced EMP workflow automation and analytics. Based on the interviews and the shared experience of food organization leaders, two key examples emerged that demonstrate the ROI of EMP automation.

Improved Production Performance

According to those interviewed, one of the primary benefits of EMP automation (and driver of ROI) is minimizing production disruptions. A temporary conveyor shutdown, unplanned cleaning, or extensive investigatory testing can add up to an astounding 500 hours annually at a multi-facility organization, and cost on average $20,000 to $30,000 per hour.2 So, it’s obvious that eliminating costly disruptions and downtime has a direct impact on ROI from this perspective.

But organizations with systems where information collected through the EMP is highly accessible have another advantage. They are able to take corrective actions to reduce production impacts very quickly. In some cases, even before a disruption happens.
By automatically feeding EMP data into an analytics program, organizations can rapidly detect the root cause of issues and implement corrective actions BEFORE issues cause production delays or shutdowns.

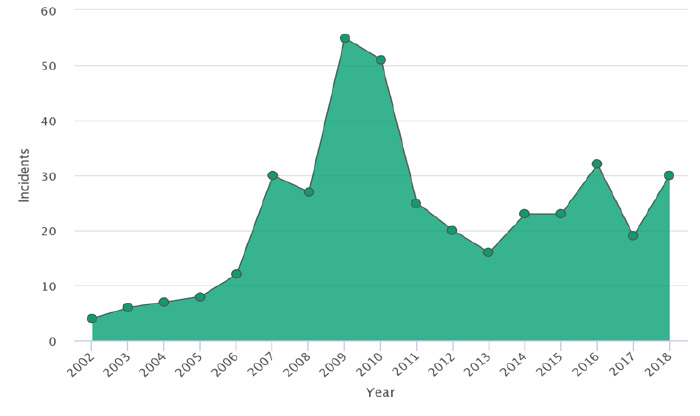
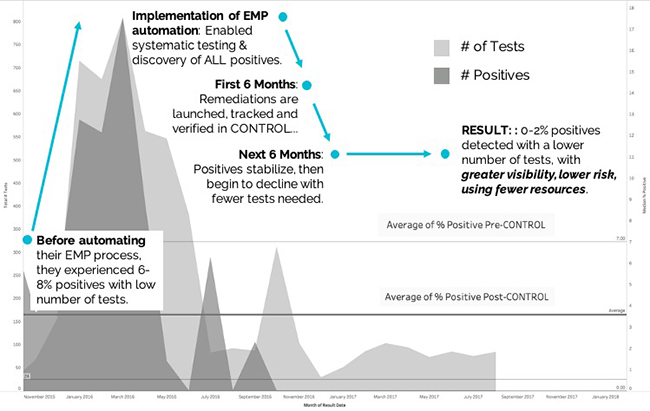
In one example, over the course of several months, a large dairy company with manual EMP processes automated its food safety workflows, improved efficiencies, reduced pathogen positives and improved its bottom line. At the start of the study, the company increased systematic pathogen testing schedules to identify where issues existed and understand the effectiveness of current sanitation efforts. With improved access to data on testing, test types and correlated sanitation procedures, the company was able to implement a revamped remediation program with more effective corrective action steps.

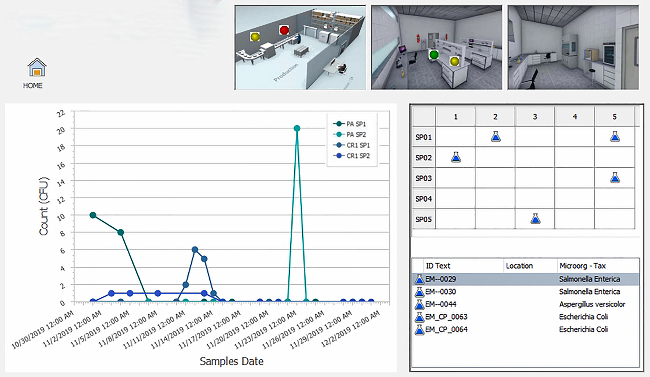
Ultimately, the automated workflows and analytics led to reduced positive results and more efficient EMP operations for the company as compared to the “crisis-mode” approach of the past. The associated costs of waste, rework, delayed production starts, and downtime caused by food safety issues were significantly reduced as illustrated in Figure 1.

EMP automation
Figure 1: Reduction of food safety testing costs through EMP automation. Customer Study 2016-2018. All figures courtesy of Corvium, Inc.

Quantifying the ROI of Production Performance Improvements

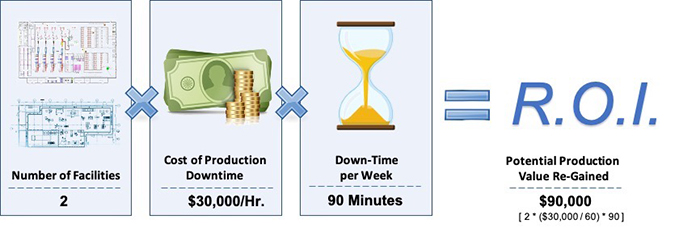
The financial impact of reducing production downtime by just 90 minutes per week can be dramatic when looked at by cumulative results over multiple weeks. In fact, eliminating just a few delayed starts or unplanned re-cleaning can have significant financial gains.

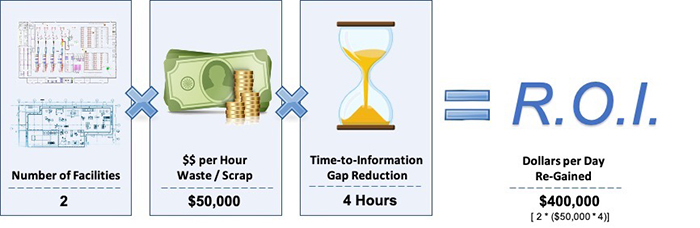
Figure 2 shows the business impact of gaining 90 minutes of production up-time per week by automating food safety operations. For the purposes of this analysis, the “sample organization” depicted operates two facilities where there are assumptions that down-time equates to a cost value of $30,000 per hour, and that both plants experience an average of 90 minutes of downtime per week that can be re-gained.

Production Performance Improvement ROI Calculation
Figure 2: Sample Production Performance Improvement ROI Calculation.

Reduced Food Waste

The second key insight uncovered in the two-year study was the impact that automating the EMP process had on waste. An estimated 30–40% of all food produced in the United States is wasted, and preventable food safety and quality issues account for a substantial portion of this waste.3

A key challenge shared by study participants was detecting food safety issues early enough to avoid wasting an entire production run. Clearly, the later in a processing or manufacturing run that issues are discovered, the greater the potential waste. To limit this, organizations needed near real-time visibility into relevant food safety and EMP data.

By automating EMP workflows, they solved this issue and created value. By tracking and analyzing data in near real time, production teams were able to keep up with ever-moving production schedules. They could define rules to trigger the system to automatically analyze diagnostic results data and alert stakeholders to outliers. Impacted food product could be quickly identified and quarantined when needed before an entire production run was wasted.

Companies included in the study realized substantial benefits from the increased efficiencies in their testing program. According to a food safety quality assurance manager at a large U.S. protein manufacturer, “Our environmental monitoring program has reached new heights in terms of accuracy, communication, visibility and efficiency. Manual, time-intensive tasks have been automated and optimized, such as the ability to search individual sample or submittal IDs, locate them quickly and make any necessary changes.”

Quantifying the ROI of Food Waste Reductions

Figure 3 shows how measuring the business impact of gaining back just 10% of scrapped food per week. For the purposes of this analysis, the “sample organization” depicted operates two facilities where there are 500 lbs. of finished product scrapped each week, and the value per pound of finished product is valued at a cost of $1 per pound.

Sample Waste Reduction ROI Calculation
Figure 3. Sample Waste Reduction ROI Calculation.

Conclusion

Automating EMP workflows decreases the time required to receive and analyze critical EMP data, helping food manufacturers achieve significant improvements in production performance, waste reduction and overall testing efficiency. By using these same ROI calculations, food brands can better illustrate how improved food safety processes can build value, and help leaders see food safety as a brand imperative rather than a cost center. As food organizations progress through each stage of digital transformation, studies like this can show real-world examples of business challenges and how other organizations uncovered value in adoption of new technologies and tools.

References

  1. CSIMarket, Inc. (2021). Total Market Profitability.
  2. Senkbeil, T. (2014). Built to Last: Maintaining Reliability and Uptime of Critical Connected Systems in Industrial Settings. Anixter.
  3. USDA. Food Waste FAQs.
Vitamins

Revamped Liquid Chromatography Enhances Analysis of Vitamins and Beyond

By Maria Grübner
No Comments
Vitamins

Vitamins play a critical role in the regulation of key physiological processes, such as blood clotting, metabolism and maintaining our vision. These biologically important compounds can be divided into two broad classes based on their solubility and differ in the way they are handled in the body—and in food safety laboratories. While excess amounts of water-soluble vitamins (including B1, B2, B3, B6 and B12) are excreted, fat-soluble vitamins (including vitamin A, D, E and K) can be stored in the liver or fatty tissue for later use. The simultaneous analysis of water- and fat-soluble vitamins in traditional liquid chromatography is difficult, and is compounded by the presence of biologically important vitamin isomers, which exist at lower concentrations and demand greater sensitivity from analytical techniques.

Food analysis laboratories support food manufacturers by assessing food safety and authenticity, and have a responsibility to produce precise and reliable data. Vitamins are among a number of compounds assessed in infant formulas, energy drinks and other supplements, and are added to fortify the nutritional value of these products. Given the critical nutritional role of vitamins, especially during early developmental periods, their characterization is highly important. This, along with the challenging and cumbersome nature of vitamin analysis, has spurred the development of innovative high-performance liquid chromatography (HPLC) methods for food safety testing.

Unique Challenges of Vitamin Analysis

The simultaneous analysis of water- and fat-soluble vitamins is difficult to achieve with reversed-phase high-performance liquid chromatography, due to the wide range of hydrophobicity among vitamins. Highly hydrophobic fat-soluble vitamins are retained strongly by chromatography columns and are only eluted with high-strength mobile phases. In contrast, water-soluble vitamins are usually poorly retained, even with very weak mobile phases. As the ideal conditions for chromatographic separation are very different for the two vitamin classes, there have been efforts to explore the possibility of operating two columns sequentially in one system. The early versions of this approach, however, were not well suited to high-throughput food safety laboratories, requiring complex hardware setup and even more complicated chromatography data system programming.

Prior to liquid chromatography analysis, food samples must be purified and concentrated to ensure target analytes can be detected without matrix interference. Liquid-liquid extraction is one purification method used to prepare for the analysis of vitamins and other compounds; it was one of the first methods developed for purification and enables compounds to be separated based on their relative solubilities in two different immiscible liquids.1 It is a simple, flexible and affordable method, yet has several major disadvantages.2 Liquid-liquid extraction consists of multiple tedious steps and requires the use of large volumes, therefore the time for completion is highly dependent on the operator’s skills and experience. Consequently, the duration of sample exposure to unfavorable conditions can vary greatly, which compromises reproducibility and efficiency of the method. This is of concern for vitamins that are particularly prone to degradation and loss when exposed to heat and light, such as vitamin D in milk powder.

Two-Dimensional Liquid Chromatography Enables Deeper and Faster Analysis

Analysts in the food industry are under pressure to process high volumes of samples, and require simple, high-throughput and high-resolution systems. Fortunately, two-dimensional liquid chromatography (2D-LC) systems have evolved markedly in recent years, and are ideally suited for the separation of vitamins and other compounds in food and beverages. There are two main types of systems, known as comprehensive and heart-cutting 2D-LC. In comprehensive 2D-LC, the sample is separated on the first column, as it would be in 1D-LC. The entire eluate is then passed in distinct portions into a second column with a different selectivity, enabling improved separation of closely eluting compounds. In contrast, heart-cutting 2D-LC is more suited to targeted studies as only a selected fraction (heart-cut) of the eluate is transferred to the second-dimension column.

Recently, another novel approach has emerged which utilizes two independent LC flow paths. In dual workflows, each sample is processed by two columns in parallel, which are integrated in a single instrument for ease of use. The columns may offer identical or different analyses to enable a higher throughput or deeper insights on each sample. This approach is highly suited to vitamin analysis, as the two reversed-phase columns enable simultaneous analysis of water- and fat-soluble vitamins. A simple, optimized preparation method is required for each of the two vitamin classes to ensure samples are appropriately filtered and concentrated or diluted, depending on the expected amount of analyte in the sample. The dual approach enables a broad range of ingredients to be assessed concurrently in supplement tablets, energy drinks, and other food and beverages containing both water- and fat-soluble vitamins. For analysts working to validate claims by food vendors, these advances are a welcome change.

Refined Detection and Extraction Methods Create a Boost in Productivity

Analysts in food analysis laboratories now have a better ability to detect a wide range of components in less time, due to improved detection and extraction methods. Modern LC systems utilize a wide range of analytical detectors, including:

  • Mass spectrometry (MS)
  • Diode array detection (DAD)
  • Multi-wavelength detection
  • Charged aerosol detection (CAD)
  • Fluorescence detection (FLD)

The optimal detector technology will depend on the molecular characteristics of the target analyte. Infant formula, for example, can be analyzed by DAD and FLD, with detection and separation powerful enough to accurately quantify the four isomers of vitamin E, and separate vitamin D2 and D3. Highly sensitive 2D-LC methods are also particularly favorable for the trace level quantitation of toxins in food, such as aflatoxins in nuts, grains and spices.

Given the limitations of liquid-liquid extraction, an alternative, simplified approach has been sought for 2D-LC analysis. Liquid-liquid extraction, prior to chromatography analysis, involves many tedious separation steps. In contrast, the use of solid phase extraction for infant formula testing reduces pre-treatment time from three hours to one hour, while improving detection. This is of great significance in the context of enterprise product quality control, where a faster, simpler pre-treatment method translates into a greater capacity of product testing and evaluation.

HPLC Toolkit for Food Safety Analysis Continues to Expand

Several other HPLC approaches have also been utilized in the field of food safety and authentication. For example, ultra-high-performance liquid chromatography (UHPLC) with detection by CAD followed by principal component analysis (PCA) can be used to investigate olive oil purity. In contrast to conventional approaches (fatty acid and sterol analysis), this revised method requires very little time and laboratory resources to complete, enabling companies to significantly reduce costs by implementing in-house purity analysis. With a reduced need for chemicals and solvents compared with fatty acid and sterol analyses, UHPLC-CAD provides a more environmentally friendly alternative.

Analyzing amino acid content in wine is an important aspect of quality control yet requiring derivatization to improve retention and separation of highly hydrophilic amino acids. Derivatization, however, is labor-intensive, error-prone, and involves the handling of toxic chemicals. To overcome these limitations, hydrophilic interaction liquid chromatography (HILIC) combined with mass detection has been identified as an alternative method. While HILIC is an effective technique for the separation of small polar compounds on polar stationary phases, there still may be cases where analytes in complex samples will not be completely separated. The combination of HILIC with MS detection overcomes this challenge, as MS provides another level of selectivity. Modern single quadrupole mass detectors are easy to operate and control, so even users without in-depth MS expertise can enjoy improved accuracy and reproducibility, while skipping derivatization steps.

Conclusion

Recent innovations in 2D- and dual LC technology are well suited to routine vitamin analysis, and the assessment of other components important in food safety evaluation. The concurrent and precise assessment of water- and fat-soluble vitamins, despite their markedly different retention and elution characteristics, is a major step forward for the industry. Drastic improvements in 2D-LC usability, flexibility and sensitivity also allows for biologically important vitamin isomers to be detected at trace levels. A shift towards simpler, high-throughput systems that eliminate complicated assembly processes, derivatization and liquid-liquid extraction saves time and money, while enabling laboratories to produce more reliable results for food manufacturers. In terms of time and solvent savings, solid phase extraction is superior to liquid-liquid extraction and is one of many welcome additions to the food analysis toolkit.

References

  1. Schmidt, A. and Strube, J. (2018). Application and Fundamentals of Liquid-Liquid Extraction Processes: Purification of Biologicals, Botanicals, and Strategic Metals. In John Wiley & Sons, Inc (Ed.), Kirk-Othmer Encyclopedia of Chemical Technology. (pp. 1–52).
  2. Musteata, M. and Musteata, F. (2011). Overview of extraction methods for analysis of vitamin D and its metabolites in biological samples. Bioanalysis, 3(17), 1987–2002.


LIMS, Laboratory information management system, food safety

How Advanced LIMS Brings Control, Consistency and Compliance to Food Safety

By Ed Ingalls
No Comments
LIMS, Laboratory information management system, food safety

Recent food scandals around the world have generated strong public concerns about the safety of the foods being consumed. Severe threats to food safety exist at all stages of the supply chain in the form of physical, chemical and biological contaminants. The current pandemic has escalated the public’s concern about cross contamination between people and food products and packaging. To eliminate food risks, manufacturers need robust technologies that allow for reliable monitoring of key contaminants, while also facilitating compliance with the ISO 17025 standard to prove the technical competence of food testing laboratories.

Without effective data and process management, manufacturers risk erroneous information, compromised product quality and regulatory noncompliance. In this article, we discuss how implementing a LIMS platform enables food manufacturers to meet regulatory requirements and ensure consumer confidence in their products.

Safeguarding Food Quality to Meet Industry Standards

Food testing laboratories are continually updated about foodborne illnesses making headlines. In addition to bacterial contamination in perishable foods and ingredient adulteration for economic gains, chemical contamination is also on the rise due to increased pesticide use. Whether it is Salmonella-contaminated peanut butter or undeclared horsemeat inside beef, each food-related scandal is a strong reminder of the importance of safeguarding food quality.

Food safety requires both preventive activities as well as food quality testing against set quality standards. Establishing standardized systems that address both food safety and quality makes it easier for manufacturers to comply with regulatory requirements, ultimately ensuring the food is safe for public consumption.

In response to food safety concerns, governing bodies have strengthened regulations. Food manufacturers are now required to ensure bacteria, drug residues and contaminant levels fall within published acceptable limits. In 2017, the ISO 17025 standard was updated to provide a risk-based approach, with an increased focus on information technology, such as the use of software systems and maintaining electronic records.

The FDA issued a notice that by February 2022, food testing, in certain circumstances, must be conducted in compliance with the ISO 17025 standard. This means that laboratories performing food safety testing will need to implement processes and systems to achieve and maintain compliance with the standard, confirming the competence, impartiality and consistent operation of the laboratory.

To meet the ISO 17025 standard, food testing laboratories will need a powerful LIMS platform that integrates into existing workflows and is built to drive and demonstrate compliance.

From Hazard Analysis to Record-Keeping: A Data-Led Approach

Incorporating LIMS into the entire workflow at a food manufacturing facility enables the standardization of processes across its laboratories. Laboratories can seamlessly integrate analytical and quality control workflows. Modern LIMS platforms provide out-of-the-box compliance options to set up food safety and quality control requirements as a preconfigured workflow.

The requirements set by the ISO 17025 standard build upon the critical points for food safety outlined in the Hazard Analysis and Critical Control Points (HACCP) methodology. HACCP, a risk-based safety management procedure, requires food manufacturers to identify, evaluate and address all risks associated with food safety.

LIMS, laboratory information management system
LIMS can be used to visualize control points for HACCP analysis according to set limits. Graphic courtesy of Thermo Fisher Scientific.

The systematic HACCP approach involves seven core principles to control food safety hazards. Each of the following seven principles can be directly addressed using LIMS:

  • Principle 1. Conduct a hazard analysis: Using current and previous data, food safety risks are thoroughly assessed.
  • Principle 2. Determine the critical control points (CCPs): Each CCP can be entered into LIMS with contamination grades assigned.
  • Principle 3. Establish critical limits: Based on each CCP specification, analytical critical limits can be set in LIMS.
  • Principle 4. Establish monitoring procedures: By defining sampling schedules in LIMS and setting other parameters, such as frequency and data visualization, procedures can be closely monitored.
  • Principle 5. Establish corrective actions: LIMS identifies and reports incidents to drive corrective action. It also enables traceability of contamination and maintains audit trails to review the process.
  • Principle 6. Establish verification procedures: LIMS verifies procedures and preventive measures at the defined CCPs.
  • Principle 7. Establish record-keeping and documentation procedures: All data, processes, instrument reports and user details remain secured in LIMS. This information can never be lost or misplaced.

As food manufacturers enforce the safety standards set by HACCP, the process can generate thousands of data points per day. The collected data is only as useful as the system that manages it. Having LIMS manage the laboratory data automates the flow of quality data and simplifies product release.

How LIMS Enable Clear Compliance and Optimal Control

Modern LIMS platforms are built to comply with ISO 17025. Preconfigured processes include instrument and equipment calibration and maintenance management, traceability, record-keeping, validation and reporting, and enable laboratories to achieve compliance, standardize workflows and streamline data management.

The workflow-based functionality in LIMS allows researchers to map laboratory processes, automate decisions and actions based on set criteria, and reduce user intervention. LIMS validate protocols and maintain traceable data records with a clear audit history to remain compliant. Data workflows in LIMS preserve data integrity and provide records, according to the ALCOA+ principles. This framework ensures the data is Attributable, Legible, Contemporaneous, Original and Accurate (ALCOA) as well as complete, consistent and enduring. While the FDA created ALCOA+ for pharmaceutical drug manufacturers, these same principles can be applied to food manufacturers.

Environmental monitoring and quality control (QC) samples can be managed using LIMS and associated with the final product. To plan environmental monitoring, CCPs can be set up in the LIMS for specific locations, such as plants, rooms and laboratories, and the related samples can then be added to the test schedule. Each sample entering the LIMS is associated with the CCP test limits defined in the specification.

Near real-time data visualization and reporting tools can simplify hazard analysis. Managers can display information in different formats to monitor critical points in a process, flag unexpected or out-of-trend numbers, and immediately take corrective action to mitigate the error, meeting the requirements of Principles 4 and 5 of HACCP. LIMS dashboards can be optimized by product and facility to provide visibility into the complete process.

Rules that control sampling procedures are preconfigured in the LIMS along with specific testing rules based on the supplier. If a process is trending out of control, the system will notify laboratory personnel before the product fails specification. If required, incidents can be raised in the LIMS software to track the investigation of the issue while key performance indicators are used to track the overall laboratory performance.

Tasks that were once performed manually, such as maintaining staff training records or equipment calibration schedules, can now be managed directly in LIMS. Using LIMS, analysts can manage instrument maintenance down to its individual component parts. System alerts also ensure timely recalibration and regular servicing to maintain compliance without system downtime or unplanned interruptions. The system can prevent users from executing tests without the proper training records or if the instrument is due for calibration or maintenance work. Operators can approve and sign documents electronically, maintaining a permanent record, according to Principle 7 of HACCP.

LIMS allow seamless collaboration between teams spread across different locations. For instance, users from any facility or even internationally can securely use system dashboards and generate reports. When final testing is complete, Certificates of Analysis (CoAs) can be autogenerated with final results and showing that the product met specifications. All activities in the system are tracked and stored in the audit trail.

With features designed to address the HACCP principles and meet the ISO 17025 compliance requirements, modern LIMS enable manufacturers to optimize workflows and maintain traceability from individual batches of raw materials all the way through to the finished product.

Conclusion

To maintain the highest food quality and safeguard consumer health, laboratories need reliable data management systems. By complying with the ISO 17025 standard before the upcoming mandate by the FDA, food testing laboratories can ensure data integrity and effective process management. LIMS platforms provide laboratories with integrated workflows, automated procedures and electronic record-keeping, making the whole process more efficient and productive.

With even the slightest oversight, food manufacturers not only risk product recalls and lost revenue, but also losing the consumers’ trust. By upholding data integrity, LIMS play an important role in ensuring food safety and quality.

Angelica Grindle, DEKRA

Four Steps for Utilizing Behavioral Science to Control Exposure to COVID-19

By Angelica Grindle, Ph.D.
4 Comments
Angelica Grindle, DEKRA

Safety is defined as controlling exposure for self and others. Going into 2020, the food industry battled safety concerns such as slips and falls, knife cuts, soft-tissue injuries, etc. As an “essential industry”, food-related organizations now face a unique challenge in controlling exposure to COVID-19. Not only must they keep their facilities clean and employees safe, they must also ensure they do not create additional exposures for their suppliers or customers.

These challenges increase at a time when employees may be distracted by stress, financial uncertainties, job insecurity, and worry for themselves and their families. Additionally, facilities may be understaffed, employees may be doing tasks they do not normally do, and we have swelling populations working from home.

While there is much we cannot control with COVID-19, there are specific behaviors that will reduce the risk of viral exposure for ourselves, our co-workers, and our communities. Decades of research show the power of behavioral science in increasing the consistency of safe behaviors. The spread of COVID-19 serves as an important reminder of what food-related organizations can gain by incorporating a behavioral component into a comprehensive exposure-reduction process.

Whether you have an existing behavior based safety process or not, follow these four steps.

Step 1: Pinpoint Critical COVID-19 Exposure Reduction Behaviors

It is critical to clearly pinpoint the behaviors you want to see occurring at a high rate. In the food industry, an organization must control exposure both within their facilities as well as during interactions with suppliers and customers. Controlling exposure within facilities will typically include those behaviors recommended by the CDC such as:

  1. Maintain six feet of separation at all times possible.
  2. Avoid touching your eyes, nose and mouth with unwashed hands.
  3. Minimize personal interactions to reduce exposure to transmit or receive pathogens.
  4. Frequent 20-second hand washing with soap and warm water.
  5. Make hand disinfectant available.
  6. Use alternatives to shaking hands.
  7. Frequently clean and disinfect common areas, such as meeting rooms, bathrooms, doorknobs, countertops, railings, and light switches.
  8. Sneeze and/or cough into elbow or use a tissue and immediately discard.
  9. Conduct meetings via conferencing rather than in person.
  10.  If you are sick, stay home.
  11. If exposed to COVID-19, self-quarantine for precaution and protection of others.

Supplier/Customer exposure-reduction behaviors will vary depending upon your specific industry and may include pinpointing the critical behaviors for food preparation, loading dock delivery, customer home delivery, and customer pick up. When creating checklists to meet your unique exposures, be sure the behaviors you pinpoint are:

  • Measurable: The behavior can be counted or quantified.
  • Observable: The behavior can be seen or heard by an observer.
  • Reliable: Two or more people agree that they observed the same thing.
  • Active: If a dead man can do it, it is not behavior.
  • Influenceable: Under the control of the performer.

Once you have drafted your checklists, ask yourself, “If everyone in my facility did all of these behaviors all the time, would we be certain that we were controlling exposure for each other, our suppliers, and our customers?” If yes, test your checklists for ease of use and clarity.

Step 2: Develop Your Observation Process

To do this, you will want to ask yourself:

  • Who? Who will do observations? Can we leverage observer expertise from an existing process and have them focus on COVID-19 exposure reduction behaviors or should we create a new observer team?
  • Where? Which specific locations, job types, and/or tasks should be monitored?
  • When? When will observers conduct observations?
  • Data: How will you manage the data obtained during the observations so that it can be used to identify obstacles to safe performance? Can the checklist items be entered into an existing database or will we need to create something new?
  • Communication: What information needs to be communicated before we begin our COVID-19 Exposure Reduction process and over time? How will we communicate it?

Step 3: Conduct Your Observations and Provide Feedback

Starting the Observation
Your observers should explain that they are there to help reduce exposure to COVID-19 by providing feedback on performance.

Recording the Observation
Observers should note on the checklist which behaviors are occurring in a safe manner (protected) and which are increasing exposure to COVID-19 (exposed).

Provide Feedback
Feedback is given in the spirit of reducing exposure. It should be given as soon as possible after the observation to reinforce protected behaviors and give the person to opportunity to modify exposed behaviors.

Success Feedback
Success feedback helps reinforce the behaviors you want occurring consistently. Effective success feedback includes:

  • Context: The situation in which the behavior occurred.
  • Action: The specific behaviors observed which reduce exposure to COVID-19.
  • Result: The impact of those behaviors on themselves or others—in this case, reduced COVID-19 exposure for themselves, their families and community.

“I care about your safety and do not want to see you exposed to COVID-19. I saw you use hand sanitizer prior to putting on eye protection. By doing that, you reduced the likelihood of transferring anything that might have been on your hands to your face which keeps you safe from contracting COVID-19.”

Guidance Feedback

Guidance feedback is given for exposed behaviors to transform that behavior into a protected one. Effective guidance feedback includes Context, Action, Result, but also:

  • Alternative Action: The behavior that would have reduced their exposure to COVID-19.
  • Alternative Result: The impact of that alternative behavior, such as reduced COVID-19 exposure for themselves, their families, and community.

“I care about your safety and do not want to see you exposed to COVID-19. I saw that you touched your face while putting on eye protection. By doing that, you increased the likelihood of transferring anything on your hand to your face which increases your risk of exposure to COVID-19. What could you have done to reduce that exposure?”

When giving guidance feedback, it is important to have a meaningful conversation about what prevented them from doing the safe alternative. Note these obstacles on the checklist.

Step 4: Use Your Data to Remove Obstacles to Safe Practices.

Create a COVID-19 exposure reduction team to analyze observation data. This team will identify systemic or organizational obstacles to safe behavior and develop plans to remove those obstacles. This is critical! When an organization knows that many people are doing the same exposed behavior, it is imperative that they not blame the employees but instead analyze what is going on in the organization that may inadvertently be encouraging these at-risk behaviors.

For example, we know handwashing and/or sanitizing is an important COVID-19 exposure reduction behavior. However, if your employees do not have access to sinks or hand sanitizer, it is not possible for them to reduce their exposure.
Similarly, the CDC recommends that people who are sick not come to work. However, if your organization does not have an adequate sick leave policy, people will come to work sick and expose their co-workers, customers and suppliers to their illness.

Your COVID-19 exposure reduction team should develop plans to remove obstacles to safe behavior using the hierarchy of controls.

Conclusion

Consistently executing critical behaviors is key to reducing exposure to COVID-19 as flattening the curve is imperative in the worldwide fight against this pandemic. Regardless of the type of behavior or the outcome that the behavior impacts, Behavior based safety systems work by providing feedback during the observations and then using the information obtained during the feedback conversation to remove obstacles to safe practices.

By using these tips, you can add a proven and powerful tool to your arsenal in the fight against COVID-19 and help keep your employees, their families, and your community safe.

Crop spraying, Ellutia

From Farm to Fork: The Importance of Nitrosamine Testing in Food Safety

By Andrew James
No Comments
Crop spraying, Ellutia

N-nitroso compounds (NOCs), or nitrosamines, have once again made headline news as their occurrence in some pharmaceuticals has led to high profile product recalls in the United States.1 Nitrosamines can be carcinogenic and genotoxic and, in the food industry, can compromise a food product’s quality and safety. One nitrosamine in particular, N-nitrosodimethylamine (NDMA), is a highly potent carcinogen, traces of which are commonly detected in foods and may be used as an indicator compound for the presence of nitrosamines.2

NOCs can potentially make their way into the food chain in a number of ways, including (but not limited to): Via the crop protection products used to maximize agricultural yields; via the sodium and/or potassium salt added to preserve certain meats from bacterial contamination; as a result of the direct-fire drying process in certain foods; and via consumption of nitrates in the diet (present in many vegetables due to natural mineral deposits in the soil), which react with bacteria and acids in the stomach to form nitrosamines.3

The crop protection and food manufacturing industries are focused on ensuring that levels of nitrosamines present in foods are minimal and safe. Detection technology for quantitating the amount of nitrosamines (ppm levels) in a sample had not advanced in nearly 40 years—until recently. Now, a thermal energy analyzer (TEA) —a sensitive and specific detector—is being relied on to provide fast and sensitive analysis for players throughout the food supply chain.

Regulatory Landscape

Both NDMA and the nitrosamine N-nitrososodiethylamine (NDEA) have been classified by national and international regulatory authorities as ‘probable human carcinogens’.3 NDMA in particular is by far the most commonly encountered member of this group of compounds.7

In the United States there are limits for NDMA or total nitrosamines in bacon, barley malt, ham and malt beverages, yet there are currently no regulatory limits for N-nitroso compounds (NOC) in foods in the EU.7

Developers of crop protection products are required to verify the absence of nitrosamines or quantify the amount at ppm levels to ensure they are within the accepted guidelines.

Crop Protection

The presence of nitrosamines must be traced and risk-managed along the food’s journey from farm to fork. The issue affects testing from the very beginning – particularly at the crop protection stage, which is one of the most highly regulated industries in the world. Without crop protection, food and drink expenditures could increase by up to £70 million per year and 40% of the world’s food would not exist.7

Development of a new crop protection product (herbicide, fungicide, insecticide or seed treatment) involves several steps: Discovery and formulation of the product, trials and field development, toxicology, environmental impacts and final registration. New product registration requires demonstration of safety for all aspects of the environment, the workers, the crops that are being protected and the food that is consumed. This involves comprehensive risk assessments being carried out, based on data from numerous safety studies and an understanding of Good Agricultural Practice (GAP).

One global producer of agrochemicals uses a custom version of the TEA to verify the absence of nitrosamines or quantitate the amount of nitrosamines (ppm levels) in its active ingredients. The LC-TEA enables high selectivity for nitro, nitroso and nitrogen (when operating in nitrogen mode), which allows only the compounds of interest to be seen. Additionally, it provides very high sensitivity (<2pg N/sec Signal to Noise 3:1), meaning it is able to detect compounds of interest at extremely low levels. To gain this high sensitivity and specificity, it relies on a selective thermal cleavage of N-NO bond and detection of the liberated NO radical by the chemiluminescent signal generated by its reaction with ozone.

The customized system also uses a different interface with a furnace, rather than the standard pyrolyser, to allow for the additional energy required and larger diameter tubing for working with a liquid sample rather than gas.

The system allows a company to run five to six times more samples with increased automation. As a direct result, significant productivity gains, reduced maintenance costs and more accurate results can be realized.

Food Analysis

Since nitrite was introduced in food preservation in the 1960s, its safety has been debated. The debate continues today, largely because of the benefits of nitrite in food products, particularly processed meats.6 In pork products, such as bacon and cured ham, nitrite is mostly present in the sodium and/or potassium salt added to preserve the meat from bacterial contamination. Although the meat curing process was designed to support preservation without refrigeration, a number of other benefits, such as enhancing color and taste, have since been recognized.

Analytical methods for the determination of N-nitrosamines in foods can differ between volatile and non-volatile compounds. Following extraction, volatile N-nitrosamines can be readily separated by GC using a capillary column and then detected by a TEA detector. The introduction of the TEA offered a new way to determine nitrosamine levels at a time when GC-MS could do so only with difficulty.

To identify and determine constituent amounts of NOCs in foods formed as a direct result of manufacturing and processing, the Food Standards Agency (FSA) approached Premier Analytical Services (PAS) to develop a screening method to identify and determine constituent amounts of NOCs in foods formed as a direct result of manufacturing and processing.

A rapid and selective apparent total nitrosamine content (ATNC) food screening method has been developed with a TEA. This has also been validated for the known dietary NOCs of concern. This method, however, is reliant on semi-selective chemical denitrosation reactions and can give false positives. The results can only be considered as a potential indicator rather than definitive proof of NOC presence.

In tests, approximately half (36 out of 63) samples returned a positive ATNC result. Further analysis of these samples by GC-MS/MS detected volatile nitrosamine contamination in two of 25 samples.

A key role of the TEA in this study was to validate the alternative analytical method of GC-MS/MS. After validation of the technique by TEA, GC-MS/MS has been proven to be highly sensitive and selective for this type of testing.

The Future of Nitrosamine Testing

Many countries have published data showing that toxicological risk from preformed NOCs was no longer considered an area for concern. Possible risks may come from the unintentional addition or contamination of foods with NOCs precursors such as nitrite and from endogenous formation of NOCs and more research is being done in this area.

Research and innovation are the foundations of a competitive food industry. Research in the plant protection industry is driven by farming and the food chain’s demand for greater efficiency and safer products. Because the amount of nitrosamines in food that results in health effects in humans is still unknown, there is scope for research into the chemical formation and transportation of nitrosamines, their occurrence and their impact on our health. Newer chromatographic techniques are only just being applied in this area and could greatly benefit the quantification of nitrosamines. It is essential that these new approaches to quality and validation are applied throughout the food chain.

References

  1. Christensen, J. (2020). More popular heartburn medications recalled due to impurity. CNN.
  2. Hamlet, C, Liang, L. (2017). An investigation to establish the types and levels of N-nitroso compounds (NOC) in UK consumed foods. Premier Analytical Services, 1-79.
  3. Woodcock, J. (2019). Statement alerting patients and health care professionals of NDMA found in samples of ranitidine. Center for Drug Evaluation and Research.
  4. Scanlan, RA. (1983). Formation and occurrence of nitrosamines in food. Cancer res, 43(5) 2435-2440.
  5.  Dowden, A. (2019). The truth about nitrates in your food. BBC Future.
  6.  Park, E. (2015). Distribution of Seven N-nitrosamines in Food. Toxicological research, 31(3) 279-288, doi: 10.5487/TR.2015.31.3.279.
  7.  Crews, C. (2019). The determination of N-nitrosamines in food. Quality Assurance and Safety of Crops & Foods, 1-11, doi: 10.1111/j.1757-837X.2010.00049.x
  8. (1989) Toxicological profile for n-Nitrosodimethylamine., Agency for Toxic substances and disease registry.
  9. Rickard, S. (2010). The value of crop protection, Crop Protection Association.
RS Spectra

Using Raman Spectroscopy to Evaluate Packaging for Frozen Hamburgers

By Gary Johnson, Ph.D.
No Comments
RS Spectra

Raman spectroscopy (RS) can be used to identify layers in polymer food packaging films to better understand the laminated plastic’s chemical composition. A Raman spectrum is obtained by illuminating a sample with a laser and collecting and measuring scattered light with a spectrometer. Coupling the spectrometer to a microscope with a mapping stage allows an accurate way to create a chemical map of a film’s composition and structure. The map provides valuable information to better understand the packaging’s barrier properties, structural integrity and layers.

The RS method can be useful for conducting failure analysis (why did a food package fail to meet standards), supply chain validation (is the plastic what the supplier claims), decision making (which plastic should be used), and evaluating package appearance (why is there discoloring, haze or particle inclusions in the film). It provides important information for design, purchasing, product success and other decisions that food manufacturers and packagers regularly face.

Take for example the packaging used for frozen hamburger patties. The film used must be transparent to display the hamburger patties, but it also needs to provide an oxygen barrier in order to prevent the ground beef from turning brown. As such, a polymer layer with low oxygen permeability must be incorporated into the laminated film, along with other components like nylon for strength and polyethylene for heat sealing and water barrier. The most common polymer used as an oxygen barrier is ethylene-vinyl alcohol copolymer (EVOH).

It is important that the film used to package these hamburger patties includes a good heat seal as well as a proper oxygen barrier layer. The possible absence of either of these could result in the undesired effect of ground beef turning brown. Manufacturers may want to test packaging for an EVOH layer to make a purchasing decision or verify a supplier’s claims. Additionally, if the packaging fails, an analysis can determine if the failure was due to having no EVOH barrier layer in the product or if there is a need to investigate other potential issues with the packaging. Regardless of the reason, RS provides a preferable method for rapidly evaluating the plastic for an EVOH oxygen barrier layer.

The RS method can be used to determine the construction of the laminated film and confirm that it meets specifications. Using the combination of RS with microscopy and mapping allows both identification of the polymers and the evaluator to correlate the composition to the layer structure of the laminated film. This method provides a map showing the composition of each layer in the film. In some cases, the Raman map will show layers that are not resolved in the visible micrograph image. Thus, with RS, one test provides both the structure and composition of each layer of the laminated film.

Laminated film, packaging, Intertek
This sample table illustrates composition and thickness of each layer of a laminated film. Table courtesy of Intertek.

To start, a small section of the film (5 x 10 mm) is cut and mounted with a photocuring resin. A cross section of the mounted film is then cut to expose the layers for analysis. This cross-section is placed on the mapping microscope stage of the Raman instrument. A micrograph image with a 100X objective is obtained and a Raman map of the cross-section with 1 µm2 pixel resolution collected.

A map image is obtained by classical least squares (CLS) fitting example spectra to each of the spectra collected from the cross-section. The example spectra for the CLS fits are averages (mean) of the spectra in the center of each layer with a unique composition as determined by the data (see Figure 1). The final result is a color-coded map that can be superimposed on the micrograph image to show the composition and thickness of each layer in the laminated film. For example, a film with six layers composed of Nylon 6, polyethylene or EVOH would have varying thickness and placement of each layer to achieve the desired result for the product.

RS Spectra
Figure 1. Example spectra used to create the CLS model for map image.

The composition map can confirm the presence of an oxygen barrier layer of EVOH, as well as the overall construction of the laminated film. Knowing the thickness of the barrier layer is important since the gas permeability is a function of the film thickness. Determination of the overall film structure allows the end-user to confirm the film meets the specifications from the supplier. In turn, this can be used to make important purchasing decisions or insights into what caused a packaging failure.

While good, successful results will confirm the presence of an EVOH layer, the RS map may also show only polymers that don’t have the required oxygen barrier properties (see Figure 2). The manufacturer would need to check it against a supplier spec sheet. It may ultimately show that the lack of an EVOH layer is what caused the issue with the packaging. If the test is being used for decision-making purposes, the manufacturer would know not to use the product. If a supply chain validation is being run, after checking the spec sheet, the manufacturer may need to correct the situation.

Raman spectroscopy
Figure 2. Raman map overlaid with image of film cross section. Green = nylon; Red = polyethylene; Yellow = ethylene vinyl alcohol copolymer (EVOH).

What if the analysis confirmed that an EVOH layer was present, but the test was done for a failure analysis, meaning the packaging did fail at some point? If the EVOH later is present but the meat is still turning brown and/or spoiling, other potential problems would need to be evaluated. In this case, the issues would most likely be with the heat seal and additional testing of the heat seal would be necessary. Thanks to the RS analysis, the investigation into the packaging failure can proceed, and the issue with the heat seal identified.

By giving a chemical image of the packaging, RS analysis provides a wealth of information about a film that can be vital to a food manufacturer or processor. Knowing why certain films may not be working, either due to faults in chemical makeup or the need to look elsewhere, such as the heat seal, RS quickly and efficiently provides information and answers to help get products to market and meet consumer demand.

Lessons Learned from Intentional Adulteration Vulnerability Assessments (Part III)

By Frank Pisciotta, Spence Lane
No Comments

Food defense is the effort to protect food from intentional acts of adulteration where there is an intent to cause harm. Like counterterrorism laws for many industries, the IA rule, which established a compliance framework for regulated facilities, requires that these facilities prepare a security plan—in this case, a food defense plan—and conduct a vulnerability assessment (VA) to identify significant vulnerabilities that, if exploited, might cause widescale harm to public health, as defined by the FDA. Lessons learned during the conduct of food defense vulnerability and risk assessments and the preparation of the required food defense plan are detailed throughout this three-part series of articles. Part I of this series addressed the importance of a physical security expert, insider threat detection programs, actionable process steps (APS) and varying approaches to a VA. Part II reviewed access, subject matter experts, mitigation strategies and community drinking water. This final article reviews broad mitigation strategies, feasibility assessments, food defense plans, partial ingredient security and the “Three Element” approach through more lessons learned from assessments conducted for the largest and most complex global food and beverage facilities, but which can also be applied to the smaller facilities that are currently in the process of readying for the next deadline of July 26.

Lesson 14: When the final rule was released, the concept of using broad mitigation strategies was eliminated. That notwithstanding and realizing that many companies seek to operate at a stricter standard for food defense with a clear focus on brand protection, versus only those process steps that potentially could result in a “wide scale public health impact.” Broad or facility-wide mitigation strategies should not be abandoned, but are less likely to get you a lot of credit for IA compliance. Including existing food safety prerequisite programs (PRP), programs and practices that are put in place to maintain a sanitary environment and minimize the risk of introducing a food safety hazard, can, in some cases, also be included as security mitigation. PRP’s with slight modifications can also contribute to a good “food defense” posture. For example, one PRP addresses hazardous chemicals and toxic substances. In some cases, non-food grade substances that could result in product contamination (not necessarily wide-scale public health impact) might be available to a disgruntled insider. It is obvious companies are concerned about contaminants being brought into the plants, but please do not overlook contaminants that are already there and ensure that they are properly secured when not in use.

Other facility-wide programs (broad mitigation) that contribute to effective food defense might include site perimeter or building security, visitor and contractor management, pre-employment background checks, employee security awareness and food defense training and sanitation chemical management.

Lesson 15: If you are using the three elements approach (Guidance Chapter 2 Section G) or the hybrid approach (Guidance Chapter 2 Section H), you will be required to make an assessment on feasibility. In the early VA’s conducted, prior to the second installment of the guidance in March of 2019, feasibility was essentially an all or nothing proposition. One could argue that a judgment call was required as to whether an intentional adulteration incident could be accomplished given the inherent conditions. Those conditions might include a lot of coworkers who might be able to observe and serve as witnesses to deter the act. With the release of the second installment of the guidance from the FDA, a new tool was made available which would allow food and beverage companies to run a calculation and make a more accurate prediction of how much of an unnamed “representative contaminant” which is assumed to be highly lethal and heat stable it might take to contaminate a product batch. Typically, the larger the batch size, the higher the quantity of the “representative contaminant” would be required to achieve a lethal dose (LD) in a serving size. So, to provide an additional level of validation with identified actionable process steps, the use of the LD calculation might be considered to provide more realistic insight into the feasibility element. For instance, if it would require one hundred pounds of the “representative contaminant,” you might feel justified in concluding that it is not realistic to get that amount of contaminant into the batch at the process step and rule out the point, step or procedure as an APS. This can save money and ensure limited food defense resources can be channeled to the areas where legitimate risk can be reduced.

Lesson 16: After an APS is identified, sites will need to determine, as the rule states, whether the existing “mitigation strategies can be applied…to significantly minimize or prevent the significant vulnerability.” Simply stated, what is in place today for food safety, and the broad-based security measures in use, may or may not be enough when you consider an insider motivated to contaminate the product. The FDA’s mitigation strategies database may offer some insights into additional food defense measures to consider. Where additional mitigation strategies are identified, from the time of completion of the VA until a site’s regulatory compliance deadline arrives (next one is July 26, 2020), that change must be incorporated into the food defense plan and fully implemented. We recommend that a site make a list of new mitigation strategies after the VA is complete for tracking purposes during the implementation phase. No mitigation strategies should be included in the food defense plan that are not fully implemented and where records cannot be adequately produced.

Lesson 17: In the second installment of the guidance, the concept of partial ingredients was introduced. The key activity types (KAT) of secondary ingredients is now considered to include the storage of partially used, open containers of secondary ingredients where the tamper-evident packaging has been breached. Tamper evident tape looked to have promising benefits, but several of our clients have abandoned the use of this mitigation strategy, which has been proven repeatedly to be defeated without detection. It appears that using containers that can be secured with numbered seals might be a better option and even better if the seals would be metal detectable in the event one went astray in a product stream.

Lesson 18: Food defense plan unification. Facilities regulated under the IA rule are likely to already have a food defense plan for other initiates such as SQF or BRC. The IA Rule is not unlike other counter-terrorism regulations in potential to create challenges to meet voluntary and regulatory requirements without having multiple food defense plans. The IA Rule based on its modeling after HACCP creates some very specific requirements in terms of how data needs to be presented and records maintained. Sites may be doing other things to support food defense, and one strategy that might keep auditors in their lane would be to include any non-IA Rule food defense content (e.g., for SQF or BRC) in an appendix to the IA Rule Food Defense Plan.

Lesson 19: Under the VA method the FDA refers to as “the “Three Element” approach, suggestion is made in the guidance released in March 2019 that regulated facilities might consider creating stratified categories for each element of public health impact, degree of physical access and ability of the attacker to successfully contaminate product. This is asking regulated facilities to engineer their own vulnerability assessment methodology. It is our opinion that this is asking a lot from a food and beverage facility and that creating categories for each element (e.g., refer to Table 3 on page 54) will extend the time it takes to complete a vulnerability assessment, create a lot more uncertainty in the process and does not necessarily help companies to identify the areas where intentional adulteration risk is highest.

Conclusion

Organizations who have yet to execute vulnerability assessments (due July 26) or those who have already completed vulnerability assessments who may wish to reflect back on their existing VAs in an effort to eliminate unnecessary APS’s should find these strategies helpful in focusing limited resources to the areas where they can have the greatest effect. Since the initiation of this article series, the FDA has released its third installment of the guidance. Once we reflect on this new installment, we will address our thoughts in a future article.

Chocolate

Chocolate and Big Data: The Recipe for Food Safety Is Changing

By Steven Sklare
No Comments
Chocolate

Almost everybody loves chocolate, an ancient, basic, almost universal and primal source of pleasure. “The story of chocolate beings with cocoa trees that grew wild in the tropical rainforests of the Amazon basin and other areas in Central and South America for thousands of years… Christopher Columbus is said to have brought the first cocoa beans back to Europe from his fourth visit to the New World” between 1502 and 1504.1

Unfortunately, the production of chocolate and chocolate products today is as complex as any other global food product with supply chains that reach from one end of the world to the other. The complexity of the supply chain and production, along with the universal demand for the finished product, exposes chocolate to increasing pressure from numerous hazards, both unintentional and intentional. For example, we know that more than 70% of cocoa production takes place in West African countries, particularly the Ivory Coast and Ghana. These regions are politically unstable, and production is frequently disrupted by fighting. While production has started to expand into more stable regions, it has not yet become diversified enough to normalize the supply. About 17% of production takes place in the Americas (primarily South America) and 9% from Asia and Oceania.2

In today’s world of global commerce these pressures are not unique to chocolate. Food quality and safety experts should be armed with tools and innovations that can help them examine specific hazards and fraud pertaining to chocolate and chocolate products. In fact, the global nature of the chocolate market, requires fast reflexes that protect brand integrity and dynamic quality processes supported by informed decisions. Digital tools have become a necessity when a fast interpretation of dynamic data is needed. If a food organization is going to effectively protect the public’s health, protect their brand and comply with various governmental regulations and non-governmental standards such as GFSI, horizon scanning, along with the use of food safety intelligent digital tools, needs to be incorporated into food company’s core FSQA program.

This article pulls information from a recent industry report about chocolate products that presents an examination of the specific hazards and fraud pertaining to chocolate and chocolate products along with ways to utilize this information.

Cocoa and chocolate products rely on high quality ingredients and raw materials, strict supplier partnership schemes and conformity to clearly defined quality and safety standards. During the past 10 years there have been a significant number of food safety incidents associated with chocolate products. The presence of Salmonella enterica, Listeria monocytogenes, allergens and foreign materials in cocoa/chocolate products have been reported on a global scale. Today, information on food safety incidents and potential risks is quickly and widely available by way of the internet. However, because the pertinent data is frequently siloed, food safety professionals are unable to take full advantage of it.

Top Emerging Hazards: Chocolate Products (2013-2018)

Publicly available data, from sources such as European Union RASFF, Australian Competition and Consumer Commission, UK Food Standards Agency, FDA, Food Standards Australia New Zealand (FSANZ), shows a significant increase in identified food safety incidents for cocoa/chocolate products from 2013 to 2018. For this same time period, the top emerging hazards that were identified for chocolate products were the following:

  • Allergens: 51.60%
  • Biological: 16.49%
  • Foreign bodies: 13.83%
  • Chemical: 7.45%
  • Fraud: 6.38%
  • Food additives & flavorings: 4.26%
  • Other hazards: 2.66%

By using such information to identify critical food safety protection trends, which we define to include food safety (unintentional adulteration) and food fraud (intentional adulteration, inclusive of authenticity/intentional misrepresentation) we can better construct our food protection systems to focus on the areas that present the greatest threats to public health, brand protection and compliance.

A Data Driven Approach

Monitoring Incoming Raw Materials
Assessment and identification of potential food protection issues, including food safety and fraud, at the stage of incoming raw materials is of vital importance for food manufacturers. Knowledge of the associated risks and vulnerabilities allows for timely actions and appropriate measures that may ultimately prevent an incident from occurring.

Specifically, the efficient utilization of global food safety and fraud information should allow for:

  • Identification of prevalent, increasing and/or emerging risks and vulnerabilities associated with raw materials
  • Comparative evaluation of the risk profile for different raw materials’ origins
  • Critical evaluation and risk-based selection of raw materials’ suppliers

A comprehensive risk assessment must start with the consideration of the identified food safety incidents of the raw material, which include the inherent characteristics of the raw material. Next, the origin-related risks must be taken into account and then the supplier-related risks must be examined. The full risk assessment is driven by the appropriate food safety data, its analysis and application of risk assessment scientific models on top of the data.

Using food safety intelligent digital tools to analyze almost 400 unique, chocolate product related food safety incidents around the globe provides us with important, useful insights about cocoa as a raw material, as a raw material from a specific origin and as a raw material being provided by specific suppliers. The graph below represents the results of the analysis illustrating the trend of incidents reported between 2002 and 2018. It can be observed that after a significant rise between 2009 and 2010, the number of incidents approximately doubled and remained at that level for the rest of the evaluated period (i.e., from 2010 to 2018), compared to the period from 2002 to 2005.

Cocoa incidents, FOODAKAI
Graph from Case Study: Chocolate Products: lessons learned from global food safety and fraud data and the guidance it can provide to the food industry,
an industry report from FOODAKAI. Used with permission.

By further analyzing the data stemming from the 400 food safety incidents and breaking them down into more defined hazards, for incoming raw materials, we can clearly see that chemical hazards represent the major hazard category for cocoa.

  • Chemical: 73.46%
  • Biological: 16.49%
  • Organoleptic aspects: 5.93%
  • Other Hazards: 4.38%
  • Fraud: 2.32%
  • Foreign bodies: 2.06%
  • Food additives and flavorings: .77%
  • Allergens: .52%
  • Food contact materials: .52%

Using the appropriate analytical tools, someone can drill down into the data and identify the specific incidents within the different hazard categories. For example, within the “chemical hazard” category specific hazards such as organophosphates, neonicotinoids, pyrethroids and organochlorines were identified.

Comparative Evaluation of Risk Profiles for Different Origins of Raw Materials
The main regions of origin for cocoa globally are Africa, Asia and South America. After collecting and analyzing all relevant data from recalls and border rejections and the frequency of pertinent incidents, we can accurately identify the top hazards for cocoa by region.

The top five specific hazards for the regions under discussion are listed in Table I.

Africa South America Asia
1 Organophosphate 2,4-dinitrophenol (DNP) 2,4-dinitrophenol (DNP)
2 Molds Pyrethroid Poor or insufficient controls
3 Neonicotinoid Aflatoxin Aflatoxin
4 Pyrethroid Cadmium Spoilage
5 Organochlorine Anilinopyrimidine Salmonella
Table I.  Top Five Hazards By Region

After the first level of analysis, a further interpretation of the data using the appropriate data intelligence tools can help to reach to very specific information on the nature of the incidents. This provides additional detail that is helpful in understanding how the regional risk profiles compare. For example, the prevalence of chemical contamination, as either industrial contaminants or pesticides, has been a commonly observed pattern for all three of the regions in Table I. However, beyond the general hazard category level, there are also different trends with regard to specific hazards for the three different regions. One such example is the increased presence of mold in cocoa beans coming from Africa.

The primary hazard categories for cocoa, as a raw ingredient were identified and a comparison among the primary hazards for cocoa by region (origin-specific) should take place. The next step in a data-powered supplier assessment workflow would be to incorporate our use of global food safety data in evaluating the suppliers of the raw materials.

The Role of Global Food Safety Data

This article has been focused on chocolate products but has only touched the surface in terms of the information available in the complete report, which also includes specific information about key raw materials. Let’s also be clear, that the techniques and tools used to generate this information are applicable to all food products and ingredients. As we strive to produce food safely in the 21st Century and beyond, we must adapt our methods or be left behind.

The regulatory environment the food industry must operate in has never been more intense. The threats to an organization’s brand have never been greater. This is not going to change. What must change is the way in which food companies confront these challenges.

Global food safety data can contribute to the establishment of an adaptive food safety/QA process that will provide time savings and improve a quality team’s efficiency and performance.

Based on the continuous analysis of food recalls and rejections by key national and international food authorities, a food safety / quality assurance manager could establish an adaptive supplier verification process and risk assessment process by utilizing the knowledge provided by such data. In that way, QA, procurement, food safety and quality departments can be empowered with critical supplier data that will inform the internal procedures for incoming materials and ingredients (e.g., raw materials, packaging materials) and allow for adaptive laboratory testing routines and compliance protocols. Moreover, food safety systems can become adaptive, enabling quality assurance and safety professionals to quickly update points of critical control when needed, and intervene in important stages of the chocolate manufacturing process.

References

  1. Discovering Chocolate. The Great Chocolate Discovery. Cadbury website. Retrieved from https://www.cadbury.com.au/About-Chocolate/Discovering-Chocolate.aspx.
  2. Chocolate Industry Analysis 2020 – Cost & Trends. Retrieved from https://www.franchisehelp.com/industry-reports/chocolate-industry-analysis-2020-cost-trends/.
Production line, NiceLabel

Farm-to-Fork Transparency: How Digitized Labeling Can Prevent a Major Allergen Recall

By Lee Patty
No Comments
Production line, NiceLabel

For consumers and brands alike, the damaging impact of mislabeling or neglecting to clearly outline an allergen can be colossal. Therefore, to prevent a health and business disaster, best practices around allergen labeling must be top of mind. Luckily, technology can help, and the farm-to-fork transparency provided by a centralized and digitized modern label management system can ensure organizations improve responsiveness and accuracy while reducing costs beyond those saved by mitigating recalls.

No one wants to face a recall, but have you done enough to prevent one from happening to you? More than 650 food products were recalled last year in the United States alone. And one of the leading causes might just be the easiest to prevent: Undeclared allergens.

According to the Q2 2019 Stericycle Recall Index, undeclared allergens are the leading cause of U.S. food recalls, accounting for 48.4% of food recalls from the FDA and 62.9% of food pounds recalled by the USDA. This statistic becomes more alarming considering that roughly 11% of US adults have a food allergy, according to JAMA.

Enacted in 2004, the Food Allergen Labeling and Consumer Protection Act (FALCPA) stipulates that all packaged food regulated under the Federal Food Drug and Cosmetic Act (FFD&C) comply by listing major food allergens. “Major allergens” refers to milk, eggs, fish, shellfish, tree nuts, peanuts, wheat, and soybeans, and for nuts and shellfish, the species must be declared.

For brands, the damaging impact of mislabeling or neglecting to clearly outline an allergen can be colossal, resulting in costly recalls or litigation. However, the impact to consumers can be even greater when one small mistake can cause serious illness, or worse, death. To prevent a health and business nightmare, best practices around allergen labeling must be top of mind.

However, with constantly changing legislation, this can be easier said than done. For instance, in a move that outpaced the FDA, Illinois issued a state law requiring sesame labeling. And in the UK, Natasha’s Law was recently introduced, requiring companies to label all food ingredients on fresh pre-packaged food after 15-year-old Natasha Ednan-Laperouse died of a sesame allergy from a sandwich that didn’t list all the ingredients.

The need for optimal allergen labeling is clear, so how can organizations ensure allergens are clearly labeled on their products and meet existing standards while preparing for future requirements?

Though the underlying principle behind a clear label is simple, the process of designing such labels can be multifaceted and difficult to streamline—especially if labels are designed, printed and managed by separate users across a franchise or store network. And this challenge is multiplied further when products reach across international boundaries. But technology can help, and the farm-to-fork transparency provided by a centralized and digitized modern label management system can ensure organizations improve responsiveness and accuracy while reducing costs beyond those saved by mitigating recalls.

Disorganized Sprawl: A Major Hurdle to Effective Labeling

When implemented properly, modern label management can cost-effectively centralize labeling, reducing inefficiencies and human error. However, before this can happen, there are a few common roadblocks that may make standardizing the labeling process challenging.

One issue may be a sprawl of legacy equipment that is not integrated into a cohesive network. For instance, a legacy labeling system may only support certain label printers while certain manufacturers of direct marking equipment may only support their own propriety brand of printers. In another sense, a lack of standardization can also make it difficult to efficiently integrate labeling with other business solutions like manufacturing execution systems (MES) and enterprise resource planning (ERP) systems.

A damaging impact of sprawl is adoption of a wide range of different labeling applications across various facilities. This will result in inconsistent label formatting, the need to create the same label multiple times, and the need to accommodate different systems and printers. Consequences of this may be a lack of centralized storage when everything is saved locally, complex user training encompassing many software programs, an increased burden on IT, and a great deal of extra administration and human intervention to maintain and update labels.

Another problem with a disorganized ecosystem for labeling is that quality assurance inevitably suffers because tracing a label’s history or implementing standardized approval processes can be difficult or impossible. To accurately track labeling, it’s necessary to have a production log stating where and when labels were produced and who produced them. Having such a log and using it effectively requires centralization or else it can become difficult to track different versions or enforce universal approval processes for altering templates.

Implementing Modernized Labeling to Improve QA

Modern label management systems can help suppliers and manufacturers standardize and control marking packaging or label production across an entire organizational ecosystem. These solutions feature a central, web-based document management system and provide a reliable storage space for label templates and label history. This will enable changes and updates to be tracked centrally, so local facilities can access uniform and accurate templates to produce labels.

An ideal label management system can also interface with a multitude of direct marking and labeling printers, even if they are from different manufacturers, and it can integrate labeling and direct marking with a business system’s master data, which eliminates manual data entry errors. This decreases upfront capital expenditures in more costly efforts to standardize equipment, provides a system that is easy to integrate with partners, saves costs generated from having to discard product or rework labels, and increases a company’s ability to implement unified, organization-wide labeling processes.

Centralized Labeling is Easily Delivered Through Cloud

To many, the thought of migrating legacy labeling to a centralized system or investing a large sum of resources into centralizing labeling may seem inordinate or daunting. However, cloud technology makes migrating to a modern label management system feasible for organizations of all sizes.

With the cloud, designing labels and ensuring quality assurance becomes far more accessible. Additionally, the software-as-a-service (SaaS) model doesn’t require the capital investments or operations and maintenance upkeep associated with costly IT infrastructure and is easily scalable depending on business needs. This is a game changer for small to medium sized businesses who can now benefit from a centralized labeling system because of the cloud.

The Benefits of a “Single-source-of-truth”

In addition to other benefits, integrating a modern label management solution with other business systems allows users to access a “single-source-of-truth.” This allows for enforceable, specific user roles with logins for each user as well as traceability and transparency across all factories that produce products. The traceability from being able to monitor a “single-source-of-truth” is a critical component to farm-to-fork transparency because it can provide an accurate production log overviewing label versions and changes, so companies can pinpoint the locations and causes of labeling inaccuracies and fix them instantly.

A modern label management system also enables organizations to nimbly respond to new regulatory requirements because alterations only need to be made in one location, new templates can be previewed before going to production, and nutrition and allergen functionality can be easily formatted so that it is clear and stands out to the consumer. This increases labeling consistency and accuracy, and saves time when rules change and when new products need to be incorporated during a merger or acquisition.

Futureproofing and Ensuring Consumer Safety with Allergen Labeling

In today’s world, food and beverage manufacturers must rise to the challenge of changing regulations while meeting the call of shifting customer demands and integrating themselves within greater business ecosystems and extended supply chains. In the case of allergen labeling, this may mean preparing labels for different countries, which have varying standards for labeling allergens like sesame, royal jelly, bee pollen, buckwheat and latex, or ensuring labels can be altered quickly when new products are rolled out or when bodies like the FDA revamp standards.

Companies that implement modern label management solutions position themselves to adapt to competition and regulations quickly, implement solutions that can easily be integrated with partners in a supply chain, and streamline quality control. This can help improve productivity, reduce labeling errors, increase collaboration, and prevent product recalls. But most importantly, it helps ensure the safety of consumers everywhere.

Salami, plastic packaging

Using Raman Spectroscopy to Evaluate Laminated Food Packaging Films

By Ellen Link, Gary Johnson, Ph.D.
No Comments
Salami, plastic packaging

Laminated plastics are common and popular food packaging options. They are strong and flexible, making them ideal for both packing and presentation, and can be used for cooking, frozen foods, drink pouches, snack products and even pet food. Yet, unreliable plastics can create a problem for food packaging and the safety of a product.

If a grade of plastic is not what was promised or needed, there can be issues that lead to spoilage, spills and messes, crystallization, mold or other risks. Additionally, there may be concerns about how laminated films will interact with the product itself, as it could impact food safety or lifecycle. For these reasons, it is critical to have accurate information when evaluating the plastics films used in food packaging.

Raman Spectroscopy

Raman spectroscopy (RS) is a powerful method of identifying and characterizing chemical compounds based on light scattering by a sample. It can be used to identify layers in food packaging films to accurately understand the chemical makeup of the laminated plastic. The effect is named for its inventor, C.V. Raman, who was awarded the Nobel prize in physics for its discovery in 1930. It is a non-destructive method that uses an induced-dipole mechanism to probe the vibrations of the chemical bonds in a molecule. The Raman spectrum shows a pattern of molecular vibrations that represents a detailed chemical fingerprint of a material, providing insights into the product composition.

A Raman spectrum is obtained by illuminating the sample with a laser and collecting and measuring the scattered light with a spectrometer. The molecular vibrational modes vary depending on the geometry and electronic structure of the chemical compound present in the sample. By controlling the position of the laser focus point on a sample, a map of the composition can be created. This provides valuable information on the plastic film related to its composition, such as number of layers, thickness of each layer and overall make-up.

In the food packaging and safety industry, this technique can be used to evaluate laminated plastic films by examining polymers, minerals, and/or inorganic fillers and pigments present in the film. Specific food packaging products that can benefit from RS assessments include heat seals, containers, lids, films and wrappers both for durability and performance and for diffusion, permeation or other concerns.

Benefits and Limitations

There are numerous benefits to using the RS method. A major advantage is that there is virtually no sample preparation necessary; spectra can be obtained without direct contact, such as through the sides of glass vials or through windows in reaction cells. As a non-destructive technique, it allows an easy, highly accurate way to take a sample, create a chemical composition map and better understand films’ barrier properties, structural integrity and layers. It has broad applicability and works using conventional microscope optics.

There are, of course, limitations to the approach, as well. Fluorescent components or impurities in a sample can emit a photoluminescent background that overwhelms the Raman scattering. Samples can also be damaged by the laser if too much power is used, or the sample absorbs light at the laser wavelength. Samples that do fluoresce and samples that are photolabile act as common interferences for the RS method. In many cases, these interferences can be overcome with the proper choice of laser and sampling techniques. Additionally, while RS provides an accurate analysis of laminated films, the technique cannot be used on metals or metallic compounds (which can be assessed using scanning electron microscopy or light optical microscopy) or organic pigments or ink layers (which can be assessed with other infrared techniques).

Using RS for Food Packaging

RS can offer a variety of insights for food packaging films:

  • Failure analysis. If a plastic used for a heat seal in a fruit or yogurt cup fails, it could result in a mess for manufacturers, stores or the consumer. Exposure to air or elements could also lead to spoilage, particularly for refrigerated foods. Inconsistent plastic packaging could result in weak points that break, crack or puncture, which could also result in mold, mess or other spoilage concerns. If a manufacturer experiences a failure in a heat seal or packaging leading to leakage or spoilage, RS analysis can help determine why the failure occurred (was in the plastic film or something else) to help prevent future issues.
  • Supply chain validation. It is extremely important that the plastic films coming from suppliers are what they are promising and what the manufacturer needs. RS analysis can be used to determine the chemical make-up and morphology of packaging to confirm a supplier’s claims before proceeding with use of the film in food packaging and products.
  • Simple decision making. If a manufacturer is trying to decide which material to use, RS can provide answers. For example, if there is a need for moisture non-permeating films and there are multiple options available, an RS chemical map can illustrate what to expect with each option, aiding in the decision-making process when combined with other known factors such as cost or timing. If there is an additive in the food product that may diffuse into the film, RS can determine which material might best resist the potential problem.
  • Packaging appearance. If there is a swirl or haze in the packaging, RS can compare the area with the issue to a clear section to determine if the defect in the film is a foreign polymer or an inorganic pigment or filler, identifying the source of the problem.

RS analysis provides a wealth of information in a manner that is non-destructive. Giving a chemical fingerprint to identify composition with extremely good spatial resolution gives manufacturers valuable information that can be used to mitigate issues, correct problems or make important decisions. These actions in turn can help ensure food safety, which builds brand image and manufacturer equity. Ultimately, RS analysis can play an important role in the success of a product, a brand or a company.