COVID-19 continues to pose challenges for every industry, influencing how they will need to adapt to the future. The food manufacturing industry specifically is continuing to see problems with plants shutting down due to outbreaks, labor shortages and domino-effect supply chain issues, forcing them to adjust in order to continue meeting the demands of customers and supplying safe food to the public.
With these adjustments in mind, changes in testing and detection in labs have arisen, influencing four main trends within food manufacturing labs expected throughout 2022.
1. Testing levels continue to increase. In 2021, some customers intentionally planned to cut testing and production in plants to balance out the loss of employees due to the pandemic-induced labor shortages within manufacturing roles.
However, following the trends of rising employment in manufacturing, 2022 should see an increase in testing, raising the baseline of production levels in the plants. According to the Bureau of Labor Statistics, manufacturing jobs saw an increase of more than 113,000 employees in Q4 of 2021. Although still below employment levels of February 2020, the continued increase is positive news for the food manufacturing industry.
2. Food testing labs turn to automation technology. Even as labs begin to see their numbers in employees rise, the demand for automation technology during 2022 will continue to climb given its proven ability to increase productivity in the lab and meet the demands of customers. With automation technology, lab technicians can multi-task thanks to the ability to step away from tests, increasing the amount of testing that can be done despite the lack of people in labs.
Additionally, utilizing ready-to-use products has cut down on the time it takes to prepare for testing. Rather than spending hours preparing Petri dishes and using an autoclave, ready-to-use Petri films or Petri dishes create easy to follow protocols with significantly less steps for a lab technician to complete.
3. Third-party labs gain popularity. With food manufacturing, tests will either be conducted on-site or at a third-party lab. Taking labor shortages into account, many manufacturers still do not have the staff numbers to maintain a dedicated on-site testing facility. As a result, manufacturers will turn to third-party labs to help increase testing volumes and productivity.
Not only have third-party labs aided manufacturers with testing, but the labs also often have the capabilities to run confirmation tests on products, tests that may not have been possible if conducted on-site. And as third-party labs have seen numerous consolidations in recent years, their capability to move products around for necessary testing is much more simplified and achievable than if testing was conducted on-site.
4. Shifting to locally sourced products. With supply chain issues continuing into 2022, the food manufacturing industry could source more products from local farmers and other local product suppliers in order to better keep up with demand.
Right now, it is much harder to receive and send products across the globe with countries and states enforcing COVID-19 restrictions and dealing with their own labor issues. Not only are labs looking to rely on locally sourced products to assist in getting products to their final destination, but consumers are also increasing their demand for locally sourced products. Specifically, consumers are looking for the reliability of food on the shelves, shorter time spent between farmer and grocery stores, as well as simply fewer people touching product throughout the chain.
Challenges in food testing labs that arose in the past couple of years are still prevalent in 2022, but from adversity comes innovation and change. With more attention on automation technology, more food manufacturing employees returning to work, and adjustments to ongoing supply chain issues, 2022 is looking more hopeful in working to return to the level of productivity food manufacturers were meeting prior to the pandemic.
Beer is one of the world’s oldest beverages, with evidence suggesting production as far back as the Bronze age. While beer is no longer used as renumeration for work as it was in the Mesopotamian Fertile Crescent, it is nevertheless a common pleasure for many people. Craft brewing is a relatively new phenomenon, and quite different from the brewing processes of antiquity. In the United States, immigrants from Germany and Czechia began to experiment with new recipes for craft beer in the 1960s. These recipes, often based on the Bavarian 16th century Reinheitsgebot, or purity laws, ensured that only the purest, highest quality ingredients went in to make beer: Water, barley, hops and yeast.
Since then, there has been a rapid growth in the number of microbreweries that experiment with “new-world” hops and grains to create huge ranges of flavorful beers that go far beyond traditional recipes. This variety in brewing ingredients and approaches has, in part, supported the explosion of a mass market for craft beer. In 2020, the global market value of craft beer was estimated at nearly $165 billion, and is expected to grow to nearly $554 Billion by 2027, with the largest growing markets in countries like China, Japan and the United States. There has also been a shift in which types of beers are consumed, with more premium or specialized craft beers increasing in market share with respect to low-cost mass-production beers.
In such a crowded and dynamic market, beer producers are faced with competitive challenges like never before. Ensuring a consistently high-quality product with a distinctive flavor profile that can be enjoyed time and time again is critical for market success. One of the key challenges standing in the way of achieving this is turbidity, or “haze”, in the end product. Such haze can give an unsightly first impression to consumers, compromise flavor, and negatively impacts shelf stability. In this article we discuss how new, advanced turbidity testing technologies are enabling brewers to quickly and efficiently eliminate haze from their beers, supporting breweries in their goals of delivering great consumer experiences again and again.
Quality over Quantity
With the growing “premiumization” of beers, ever-greater attention and importance is being placed on interesting and consistent flavor profiles. Often, this includes beers made from ingredients far outside the relatively strict Reinheitsgebot recipe, including additions such as coffee, fruit and spices. The emphasis on more complex flavor profiles is pushing beer tasting to be taken as seriously as wine tasting, with perfectly balanced beers often being designed to match certain foods.
However, the addition of these newer ingredients can introduce challenges into the brewing process, especially as they can be sources of turbidity-causing impurities that may affect the quality, flavor and shelf stability of the final product. This is particularly challenging when beer brewing is scaled up to larger manufacturing quotas, where careful control of variables like ingredient choices, recipes and manufacturing methods are critical for ensuring the consistency and quality of the beer from batch to batch.
To meet these needs, modern breweries are increasingly using new and advanced technologies throughout the brewing process to maintain high quality products. Technologies like water purification systems, titrators and portable instruments such as hand-held pH meters and spectrophotometers are all being utilized to improve and refine the manufacturing process. A major focus of this technological drive is in turbidity detection and removal.
What Is Haze, and Where Does It Come From?
Haze is a broad term referring to evenly distributed turbidity—suspended, insoluble material which can appear in the final product. Haze can be divided into several types, most commonly: Chill haze, a temporary haze that disappears when a chilled beer warms to room temperature; and permanent haze, which is present at all temperatures. Haze can also be divided into biological haze (caused by microbiological growth in the beer) and non-biological haze (caused by a wide variety of non-living material, such as peptides, polyphenols and starches).
With the rising popularity of craft beer, many companies and customers are embracing intentionally ‘cloudy’ beers, which can make detecting offending turbidity even more challenging. All images courtesy of Thermo Fisher Scientific.
Since turbidity can be the result of unwanted microbes, wild yeast or protein particles, these deposits, although not unsafe to consume, can significantly alter the flavor profile of the beer, adding unpleasant acidity, sourness, or even “off” flavors. Bacteria are one of the major sources of turbidity in beers, particularly lactic acid-producing bacteria (LAB), such as Lactobacillus. While small amounts of lactic acid can add pleasant, desirable sour flavors in sour beers, the over-presence of these bacteria can be a major cause of contamination, so their levels must be closely monitored in the brewing process. Other bacteria like Pectinatus species can also “infect” beers, causing turbidity as well as “off” aromas and flavors due to the creation of hydrogen sulfide and fatty acids.
Importantly, turbidity-causing compounds can collect in the product from all stages of the brewing process:
This starts with the source of water, and how it is filtered and treated. For example, a high presence of calcium in brewing water can cause precipitation of calcium oxalate.
Mashing, the first stage of the brewing process, produces a malt extract from mixing grains and water. The malt extract is a liquid containing sugar extracted during mashes and has high viscosity and high protein content. At this stage fungi (like Penecillium), wild yeasts (Candida) and bacteria can all enter the mix to cause turbidity later on.
From there, the process of lautering separates the wort from the grain. The wort is then boiled with hops, clarified, then fermented with yeast. The fermentation process is a common step when turbidity-causing bacteria like Lactobacillus and Pediococcus can contaminate the mixture.
The fermented beer product is then stored for anything from three weeks to three months in a storage tank where a second fermentation takes place. Then it is filtered and packaged into barrels, bottles, or cans; all of which are also potential sources of turbidity-causing bacteria like Pectinatus.
The filtration and pasteurization processes are key for removing sources of turbidity. However, these processes do not necessarily remove all sources of turbidity, especially if aspects of the brewing process are altered by external factors (e.g., subtle shifts in the mashing temperatures) and cause a buildup of contaminants that is too great to filter out. Therefore, effectively monitoring and minimizing turbidity throughout the brewing process is critical, allowing brewers to make timely corrective adjustments, reducing a buildup of contaminants in the final product.
Advanced Methods for Turbidity Testing
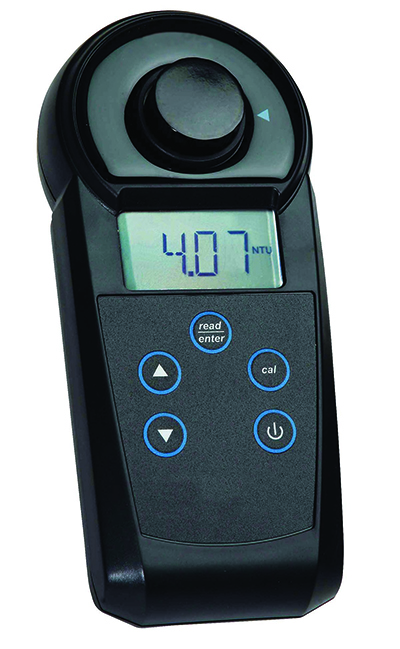
To support effective haze removal and ensure beer consistency, turbidity measurements must be taken throughout the entire brewing process. Measurements should therefore be quick and efficient, and able to measure large quantities of beer in a short space of time, especially in high-production breweries. As such, advanced on-site turbidity testing technologies that are efficient and easy to use are ideal, and can rapidly streamline quality control in the brewing process. For example, with turbidity meters, breweries can swiftly check that their fining or filtration process is yielding a desired end product, and if an issue arises during the clarification process, an onsite turbidity measurement can pick this up right away for speedy corrective action. Such speedy rectification minimizes the chances of ruined batches and resultant profit loss to the brewery.
Advanced portable turbidity meters enable efficient and reliable measurements on-site to streamline quality control in the brewery.
Modern turbidity meters work by using an infrared LED light source to measure light scattering in a solution. These handy devices allow brewers to perform rapid testing of beer with simple grab samples, meaning samples can be analyzed without having to disturb the brewing process. The LED light sources used in more advanced meters also have several benefits. For example, the LED does not require a warm-up period like older tungsten lamps, meaning it is ready to use at all times. Secondly, infrared LED light sources prevent color interference, which is especially useful for testing darker beers. Finally, the LED will last the life of the meter and give stable signals, meaning that calibration does not drift. Turbidity meters can also test for chill haze, allowing brewers to check for problems that can cause the beer to turn cloudy during prolonged chilling.
Quality Kings
Quality control of the brewing process is crucial for maintaining the quality and consistency of beer products that keep customers returning time and time again to their beers of choice. In a hyper-competitive market, brewers must use all the advantages they can to stay ahead of the game. Hazy beers can be particularly off-putting to customers if they are expecting bright, clear products, and critical qualities like taste and aroma can be very unpleasant if contamination isn’t carefully controlled. Moreover, unwanted turbidity in beers can negatively impact shelf stability, with resultant impact on profitability and brand reputation.
Owing to the complexity of beer making, the sources of turbidity are multiple, meaning that careful testing of turbidity is critical. In helping to overcome these challenges, advanced turbidity meters are enabling brewers to perform efficient and simple measurements on-site throughout the brewing process. This is helping to drive more timely tweaks to the brewing, filtration and storage steps to ensure consistent, high-quality beers with carefully crafted flavor profiles reach the market.
Globally, milk and dairy products rank among the top eight allergens that affect consumers across the world. In America in particular, 32 million people suffer from some form of allergy, of which a staggering 4.7 million are allergic to milk. Additionally, it is estimated that around 70% of adults worldwide have expressed some form of lactose intolerance. As such, it is important for key stakeholders in the dairy industry to create novel products that meet the wants and needs of consumers.
Low-lactose products have been available since the 1980s. But in recent years, the demand for plant-based alternatives to dairy products has been on the rise. Some of this demand has come from individuals who cannot digest lactose or those that have an allergy to dairy. However, as all consumers continue to scrutinize their food labels and assess the environmental and ethical impact of their dietary choices, plant-based milk has become an appealing alternative to traditional dairy products.
To adapt to this changing landscape, traditional dairy processors have started to create these alternatives alongside their regular product lines. As such, they need access to instruments that are flexible enough to help them overcome the challenges of testing novel plant-based milk, while maintaining effective analysis and testing of conventional product lines.
Some consumers—although not allergic to dairy—lack the lactase enzyme that is responsible for breaking down the disaccharide, lactose, into the more easily digestible glucose and galactose.
Low-lactose products first started to emerge in 1985 when the USDA developed technology that allowed milk processors to produce lactose-free milk, ice cream and yogurt. This meant consumers that previously had to avoid dairy products could still reap their nutritional benefits without any adverse side effects.
Similar to conventional dairy products, routine in-process analysis in lactose-free dairy production is often carried out using infrared spectroscopy, due to its rapid reporting. Additionally, the wavelengths that are used to identify dairy components are well documented, allowing for easier determination of fats, proteins and sugars.
Fourier transform infrared (FTIR) technologies are the most popular of the infrared spectroscopy instruments used in dairy analysis. As cream is still very liquid, even at high solid levels, FTIR can still effectively be used for the determination and analysis of its components. For products with a higher percentage of solids—usually above 20%—near-infrared (NIR) spectroscopy can provide much better results. Due to its ability to penetrate pathlengths up to 20 mm, this method is more suitable for the analysis of cheeses and yogurts. For low-lactose products in particular, FTIR technology is integral to production, as it can also be used to monitor the breakdown of lactose.
Finger on the Pulse
For some consumers, dairy products must be avoided altogether. Contrary to intolerances that only affect the digestive system, allergies affect the immune system of the body. This means that allergenic ingredients, such as milk or dairy, are treated as foreign invaders and can result in severe adverse reactions, such as anaphylactic shock, when ingested.
From 2012 to 2017, U.S. sales of plant-based milk steadily rose by 61%. With this increasing demand and the need to provide alternatives for those with allergies, it has never been a more important time to get plant-based milk processing right the first time. Although the quantification of fat, protein and sugar content is still important in these products, they pose different challenges to processors.
In order to mimic traditional dairy products, plant-based milk is often formulated with additional ingredients or as a blend of two plant milks. Sunflower or safflower oil can be added to increase viscosity and cane syrup or salt may be added to enhance flavor. All of these can affect the stability of the milk, so stabilizers or acidity regulators may also be present. Additionally, no plant milk is the same. Coconut milk is very high in fat content but very low in protein and sugar; on the other hand, oat milk is naturally very high in carbohydrates. This not only makes them suitable for different uses, but also means they require different analytical procedures to quantify their components.
Although many FTIR and NIR instruments can be applied to plant-based milk in the same way as dairy milk, the constantly evolving formulation differences pose issues to processors. For example, the way that protein is determined in dairy milk will vary from the way protein is determined in almond milk. Both will follow a method of quantifying the nitrogen content but must be multiplied by a different factor. To help overcome these challenges, many companies have started to develop plant-based milk calibrations that can be used in conjunction with existing infrared instruments. Currently, universal calibrations exist to determine the protein, fat, solids, and sugar content of novel products. With more research and data, it’s likely in the future these will be expanded to generate calibrations that are specific to soy, almond and oat milk.
Even with exciting advancements in analytical testing for plant-based milk, the downtime for analysis is still a lot higher than traditional dairy. This is due to the increased solid content of plant-based milk. Many are often a suspension of solid particles in an aqueous solution, as opposed to dairy milk, which is a suspension of fat globules in aqueous solution. This means processors need to factor in additional centrifuge and cleaning steps to ensure results are as accurate and repeatable as possible.
In addition to the FTIR and NIR instruments used for traditional dairy testing, plant-based milk can also benefit from the implementation of diode array (DA) NIR instruments into existing workflows. With the ability to be placed at- and on-line, DA instruments can provide continual reporting for the constituent elements of plant-based milk as they move through the processing facility. These instruments can also produce results in about six seconds, compared to the 30 seconds of regular IR instruments, so are of great importance for rapid reporting of multiple tests across a day.
Keeping It Simple
Although the consumption of dairy-free products is on the rise, lots of plant-based milk are also made from other allergenic foods, such as soy, almonds and peanuts. Therefore, having low-lactose alternatives on the market is still valuable to provide consumers with a range of suitable options.
To do this, dairy processors and new plant-based milk processors need access to instruments that rapidly and efficiently produce accurate compositional analysis. For dairy processors who have recently started creating low-lactose or dairy-free milk alternatives, it is important that their instrumentation is flexible and used for the analysis of all their product outputs.
Looking towards the future, it’s likely both dairy products and their plant-based counterparts will have a place in consumers’ diets. Although there is some divide on which of these products is better—both for the environment and in terms of health—one thing that will become increasingly more important is the attitude towards the labeling of these products. Clean labels and transparency on where products are coming from, and the relative fat, protein and sugar content of foods, are important to many consumers. Yet another reason why effective testing and analytical solutions need to be available to food processors.
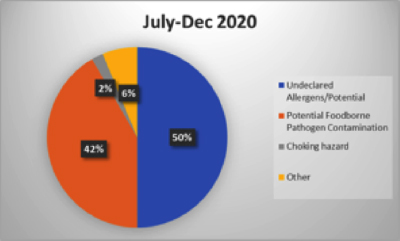
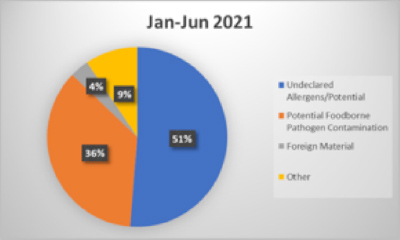
The first half of 2021 saw almost a 20% increase in recalls vs. the last 6 months of 2020 (117 vs. 96). According to a recent report by Lathrop GPM, LLC, food producers have seen an increase in food safety incidents since the pandemic began, and expect an ongoing increase over the next year.1 A majority of recalls were due to undeclared allergens or potential for allergen cross contamination. Second to allergens were potential for microbiological contaminants, including Salmonella, Listeria, E. coli, and Cyclospora.
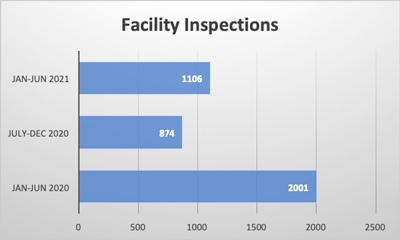
Figure 1 and 2. The first half of 2021 saw a 26% increase of facility inspections by the FDA. Despite this jump, inspections in the first half of 2020 were 80% higher than this year’s first six months. Source: FDA Recalls, Market Withdrawals, & Safety Alerts.
Inspection Results
The first half of 2021 saw a 26% increase of facility inspections by the FDA. Despite this jump, inspections in the first half of 2020 were 80% higher than this year’s first six months. Inspections generally lead to three outcomes; No Action Indicated (continue as you were,) Voluntary Action Indicated (voluntary to make some changes), or Official Action Indicated (OAI) (Regulatory Actions will be recommended by the FDA). A majority of inspections (56%) resulted in NAI this year, compared to 59% and 50% in the first and second halves of 2020, respectively.
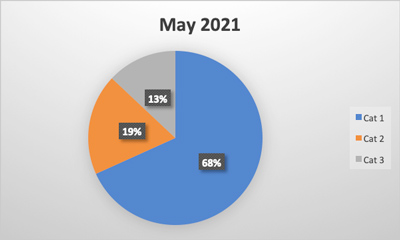
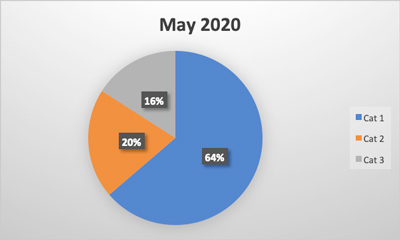
The FSIS provides ongoing surveillance of Salmonella and Campylobacter presence in poultry, both domestic and imported. Salmonella is reported by facility and each is given a category rating of 1–3. One is exceeding the standard (based on a 52-week moving average), two is meeting the standard, and three is below standard. For the 52-week reporting period ending May 30, 2021, 60% achieved category one, compared to 56% the previous 52 weeks.
Figures 4 & 5. Salmonella surveillance data from FDA.
Listeria and Salmonella Surveillance in RTE Meat and Poultry
USDA FSIS conducts periodic sampling of Ready to Eat (RTE) meat and poultry products and reports quarterly results. Sampling is conducted both in a random fashion as well as based on risk-based sampling. In Q2 2021, 4769 samples were tested for Listeria, compared to 4632 in Q1.
Percent positive rates were .36% for Q2 and .43% for Q1. Neither quarter reported any positives for Listeria in imported RTE Meat and Poultry Products.
Salmonella samples for RTE totaled 3676 in Q2 2021, compared with 3566 in Q1. In both quarters, only 1 positive was found in the samples collected.
Routine Beef Sampling for E. coli 0157:H7 and STEC
The FSIS also conducts ongoing routine sampling of beef products for E. coli. E. coli is further classified into 0157:H7 and non-0157:H7 Shiga toxin-producing E. coli (STEC). In Q2 of 2021, 4467 samples were collected and tested for 0157:H7 versus 4268 in Q1. Of these, three were positive, compared to seven positives the preceding quarter. For STEC, a total of 8 positives were found, compared to 1 positive in Q1. No positives were found in imported goods in Q2, although in Q1 2021, 4 positives for STEC were found.
Conclusion
The first half of 2021 showed an increase in activity, which is on par with food industry survey data. Food recalls have increased, with food allergens remaining the most prevalent reason for recall or withdrawal. While inspections also increased, they have not returned to pre-pandemic levels. The impact of the spread of the Delta variant and increased restrictions is yet to be seen, but inspection activity will likely not rebound entirely by the end of the year. Pathogen tests by FSIS increased quarter over quarter for Salmonella, E. coli, and STEC, with mixed results in prevalence.
The food allergen testing industry has garnered considerable traction across North America, especially due to the high volume of processed food and beverages consumed daily. Allergens are becoming a significant cause for concern in the present food processing industry worldwide. Food allergies, which refer to abnormal reactions or hypersensitivity produced by the body’s immune system, are considered a major food safety challenge in recent years and are placing an immense burden on both personal and public health.
In 2019, the most common reason behind recalls issued by the USDA FSIS and the FDA was undeclared allergens. In light of this growing pressure, food producers are taking various steps to ensure complete transparency regarding the presence of allergenic ingredients, as well as to mitigate risk from, or possibly even prevent contact with, unintended allergens. One of these steps is food allergen testing.
Allergen detection tests are a key aspect of allergen management systems in food processing plants and are executed at nearly every step of the process. These tests can be carried out on work surfaces, as well as the products, to detect any cross contamination or allergen presence, and to test the effectiveness of a food processing unit’s cleaning measures.
There has been a surge in awareness among consumers about food allergies and tackling the risk of illnesses that may arise from consuming any ingredient. One of the key reasons for a higher awareness is efforts to educate the public. In Canada, for example, May has been designated “Food Allergy Awareness Month”. It is estimated that more than 3 million people in Canada are affected by food allergies.
The size of the global food allergen testing market is anticipated to gain significant momentum over the coming years, with consistent expansion of the dairy, processed food and confectionary segments.
Understanding the Prevailing Trends in Food Allergen Testing Industry
Food allergies risen nearly 50% in the last 10 years, with a staggering 700% increase observed in hospitalizations due to anaphylaxis. Studies also suggest that food allergies are a growing health concern, with more than 250 million people worldwide estimated to be affected.
Although more than 170 foods have been identified as causing food allergies in sensitive consumers, the USDA and the FDA have identified eight major allergenic foods, based on the 2004 FALCPA (the Food Allergen Labeling and Consumer Protection Act). These include eggs, milk, shellfish, fish, peanuts, tree nuts, soybean, and wheat, which are responsible for 90% of allergic reactions caused due to food consumption. In April 2021, the FASTER (Food Allergy Safety, Treatment, Education, and Research) Act was signed into law, which categorized sesame as the ninth major food allergen.
This ever-increasing prevalence of allergy-inducing foods has presented lucrative opportunities for the food allergen testing industry in recent years since food processing business operators are placing a strong emphasis on ensuring transparency in their products’ ingredient lists. By testing for allergens in food products, organizations can accurately mention each ingredient, and thereby allow people with specific food allergies to avoid consuming them.
Several allergen detection methods are used in the food processing industry, including mass spectrometry, DNA-based polymerase chain reaction (PCR) as well as ELISA (enzyme-linked immunosorbent assay), to name a few. The FDA, for instance, created a food allergen detection assay, called xMAP, designed to simultaneously identify 16 allergens, including sesame, within a single analysis, along with the ability to expand for the targeting of additional food allergens. Such industry advancements are improving the monitoring process for undeclared allergen presence in the food supply chain and enabling timely intervention upon detection.
Furthermore, initiatives, such as the Voluntary Incidental Trace Allergen Labelling (VITAL), created and managed by the Allergen Bureau, are also shedding light on the importance of allergen testing in food production. The VITAL program is designed to support allergen management with the help of a scientific process for risk assessment, in order to comply with food safety systems like the HACCP (Hazard Analysis and Critical Control Point), with allergen analysis playing a key role in its application.
ELISA Gains Prominence as Ideal Tool for Food Allergen Testing
In life sciences, the detection and quantification of various antibodies or antigens in a cost-effective and timely manner is of utmost importance. Detection of select protein expression on a cell surface, identification of immune responses in individuals, or execution of quality control testing—all these assessments require a dedicated tool.
ELISA is one such tool proving to be instrumental for both diagnostics as well as research). Described as an immunological assay, ELISA is used commonly for the measurement of antibodies or antigens in biological samples, including glycoproteins or proteins.
While its utility continues to grow, ELISA-based testing has historically demonstrated excellent sensitivity in food allergen testing applications, in some cases down to ppm (parts per million). It has a distinct advantage over other allergen detection methods like PCR, owing to the ability to adapt to certain foods like milk and oils, where its counterparts tend to struggle. The FDA is one of the major promoters of ELISA for allergen testing in food production, involving the testing of food samples using two different ELISA kits, prior to confirming results.
Many major entities are also taking heed of the growing interest in the use of ELISA for food allergen diagnostics. A notable example of this is laboratory analyses test kits and systems supplier, Eurofins, which introduced its SENSISpec Soy Total protein ELISA kit in September 2020. The enzyme immunoassay, designed for quantitative identification of soy protein in swab and food samples, has been developed by Eurofins Immunolab to measure residues of processed protein in various food products, including instant meals, chocolate, baby food, ice cream, cereals, sausage, and cookies, among others.
In essence, food allergens continue to prevail as high-risk factors for the food production industry. Unlike other pathogens like bacteria, allergenic proteins are heat resistant and stable, and cannot easily be removed once present in the food supply chain. In this situation, diagnostic allergen testing, complete segregation of allergenic substances, and accurate food allergen labeling are emerging as the ideal courses of action for allergen management in the modern food production ecosystem, with advanced technologies like molecular-based food allergy diagnostics expected to take up a prominent role over the years ahead.
The food safety testing industry is constantly experiencing new developments, technological advances and regulatory pressures as the burden of foodborne illness remains a prevalent concern. Growing consumer preference for convenience and processed foods is a pivotal trend augmenting the industry outlook.
The World Health Organization (WHO) reports that every year nearly $110 billion is lost across middle- and low-income countries due to unsafe food. From the health risk perspective, pathogens, pesticides or toxins cause more than 200 diseases, ranging from diarrhea to cancers. Since most foodborne illnesses are preventable, WHO and other public health organizations worldwide are taking necessary action to establish strong and resilient food safety systems and enhance consumer awareness.
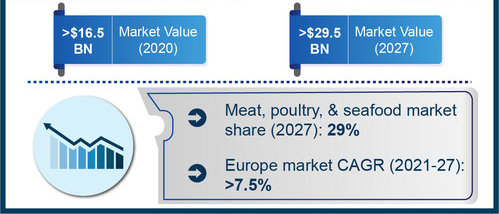
Food products may become contaminated at any stage of production, supply or distribution. Testing food and beverage products for safety is a critical component of the food and beverages sector. In terms of annual valuation, the global food safety testing market size is anticipated to hit $29.5 billion by 2027.
Pathogen Testing Demand Rises as E. coli, Salmonella Infections Persist
Pathogen testing is of utmost importance to the food & beverage industry, as there remains a large number of virus and bacteria causing pathogens and microbial agents responsible for foodborne illnesses. Numerous instances of pathogen contamination have come to light recently, augmenting the need for food pathogen testing, especially during a time when COVID-19 poses a significant threat.
For instance, in July, the CDC and the FDA announced that they are working with other public health agencies to investigate an outbreak of E. coli O121 infections across 11 states. Meanwhile in the European Union, several countries have started investigating Salmonella illnesses linked to imported tahini and halva. Since 2019, about 80 people are estimated to be affected in Germany, Denmark, Norway, Sweden and the Netherlands.
Pathogen testing demand will likely increase across North America and Europe with further spread of infections. These regions are among the major consumers of processed meat, seafood and poultry products, augmenting the need for reliable food safety testing solutions.
Meat, Poultry and Seafood Consumption Drive Foodborne Infection Risks
Globally more individuals are consuming processed poultry and meat products at home, in restaurants, fast food restaurants, and other locations. The worldwide meat consumption is estimated to reach 460 to 570 million tons by the year 2050, as per data from The World Counts.
It is essential to ensure optimum product quality during meat processing to minimize the perils of foodborne microorganisms. Meat quality testing standards are continuously evolving to ensure that food manufacturers bring the best-quality products to the market. In July this year Tyson Foods recalled more than 8.9 million pounds of ready-to-eat chicken products due to potential Listeria monocytogenes contamination. The significant recall quantity itself represents the scope of pathogen testing requirements in processed meat sector.
E. coli O157 is considered to increase the risk of toxins that lead to intestinal problems and can cause significant illness among geriatric people, pregnant women and other high-risk populations. Earlier this year, PerkinElmer introduced an E. coli O157 pathogen detection assay to be used for testing raw ground beef and beef trim. The solution is greatly suited for food and beverage sector customers that need to test high volumes of food samples regularly. The development indicates an incessant fight to offer effective food safety testing products to tackle the threat of pathogen-related illnesses.
USDA’s FSIS also recently revised guidelines for controllingSalmonella and Campylobacter infections in raw poultry. The updated guidelines provide poultry establishments with best practices that they may follow to reduce the risk of such infections in raw products.
Food Safety Testing Trends amid COVID-19 Pandemic
Food safety testing demand has experienced a notable uptick since the outbreak of the coronavirus pandemic, as food security and sustainability have been recognized as key areas of focus.
Globally, a rise in online orders of groceries and restaurant meals has been observed. Major food regulators such as the FDA have released food safety protocols and guidelines for food companies, hotels and restaurants. These practices help ensure optimum food quality as well as the safety of employees, staff and consumers.
The FDA has been working with the USDA and FSIS as well as state authorities to investigate foodborne illnesses and outbreaks amid the pandemic. Many regions are also updating food safety policies to help overcome the challenges of the pandemic. While pathogen and toxin testing demand are growing in most regions, the inadequacy of food control infrastructure may limit food safety testing industry expansion in emerging economies.
Drawbacks of existing technologies and the need to reduce sample utilization, lead time and testing cost are driving new innovations in food safety testing. Ongoing developments are focused on providing accurate results in limited timespan.
The food safety testing market landscape will continue to evolve as new regulations are introduced, public awareness rises, and food consumption patterns change. The rapid testing technology segment, which includes PCR, immunoassay and convenience testing, is estimated to hold a major share of the overall industry owing to faster results provided, which benefits the organizations in terms of productivity and processing costs. In addition to previously discussed PerkinElmer, Eurofins Central Analytical Laboratories Inc, Bio-Rad Laboratories, Intertek Group PLC, Bureau Veritas SA, and SGS AG are some of the other notable names in the industry.
In recent years, foodborne illness has ignited alarming concerns across the globe. Food products can become contaminated with pathogenic bacteria through exposure to inadequate processing controls, animal manure, improper storage or cooking, and cross contamination. The following is a look at some of the pivotal figures that illustrate the effects of food contamination:
• According to WHO, an estimated of 600 million people globally fall ill after consuming contaminated food, of which 420,000 succumb to death every year.
Children under 5 years of age carry 40% of the foodborne disease burden, with 125,000 fatalities recorded annually.
Considering the financial aspects, it is essential to note that about $110 billion is lost almost every year in productivity and medical expenses from unsafe food consumption in low-and middle-income economies.
With such daunting numbers taking over the globe, there stands an innate requirement of cost-effective, easy-to-use, and accurate testing methods that ensure the consumer is delivered nothing but the safest food.
Why is pathogen testing necessary? Pathogen testing is generally carried out to decrease and remove foodborne illnesses. It is a technique implemented in the very nascent stage of food production to ensure proper sanitation and food safety. The testing can be done using conventional technologies or the cutting-edge methods, including Polymerase Chain Reaction (PCR) or an immunoassay test.
PCR technology: An ideal and convenient technology in use for pathogen detection in food industry
PCR is one of the most frequently used technologies. The test enables the detection of a single bacterial pathogen, including E. Coli, Salmonella and Listeria, present in food by detecting a specific target DNA sequence. Aiding to such advantages, various business conglomerates that are involved in the food pathogen testing industry are taking strategic measures to bring forth novel innovations and practices in the space. The following is a brief snapshot of some developments in the PCR based pathogen testing technology landscape:
Sanigen, Ilumina partnership for development of NGS panel
Owing to the escalating demand for PCR testing technology for detecting the presence of food pathogens, South Korea-based Sanigen, recently announced standing as a channel partner in the region for Illumina. Both the companies, in unison, are expected to work towards the development of NGS panels that can robustly detect 16 types of foodborne pathogen from around 400 samples.
Thermo Scientific’s 2020 launch of SureTest PCR Assays
Last year Thermo Scientific expanded its portfolio of foodborne pathogen detection with the launch of the SureTest PCR Assays. The testing technology is poised to offer various food producers an access to a more holistic range of tests for every step of the analysis process.
A look at one sector: How is the expanding dairy sector complementing the growth structure of food pathogen testing market?
The dairy production industry is rapidly expanding in various developing and developed economies, marking a significant contribution to health, environment, nutrition and livelihoods. According to a National Farmers Union report, the U.S. dairy industry accounts for 1% of the GDP, generating an economic impact of $628 billion, as of 2019. However, dairy products, although deemed healthy, can contribute to severe human diseases in umpteen ways, with dairy-borne diseases likely to top the list.
Milk and products extracted from the milk of dairy cows can house a variety of microorganisms, emerging as a source of foodborne pathogens. This has pushed the need for appropriate testing methods and technologies, which can eliminate the presence of dairy-borne bacteria, like Salmonella.
Today, various rapid pathogen testing solutions that are suitable for detecting the presence of distinct bacteria and organisms are available for dairy-based food companies. For instance, PCR-based solutions are available to test for mastitis in dairy, which is a common rudder infection caused by microorganisms in dairy cattle, affecting the quality of milk. Apparently, Thermo Fisher offers VetMAX MastiType qPCR kits for relatively faster, efficient and easier mastitis diagnostics. In fact, the kits are deemed to be reliable tools that would accurately detect all mastitis causing bacteria in frozen, fresh and preserved milk samples.
Meat Products
Consumption of raw or undercooked meat is also expected to generate a significant food pathogen testing kits demand in the coming years. Common contaminants found in these products are E. coli and Salmonella. One of the strains of E. coli, Shiga Toxin-producing E. coli (STEC), is expected to emerge as a fatal contaminant present in the meat products. Consider the following:
WHO reports estimate that up to 10% of patients with STEC infection are vulnerable to developing haemolytic uraemic syndrome (HUS), with a case-mortality rate ranging from 3 to 5%.
Moreover, it has the ability to cause neurological complication in 25% of HUS patients and chronic renal sequelae, in around 50% of survivors.
Under such circumstances, the demand for pathogen testing in meat products, for detecting E. coli and other contaminants is gradually expanding worldwide. In January this year, PerkinElmer introduced its new tool for detection of E. coli O157 in food products. The kit has been developed for generating rapid results while simultaneously putting them forth to support food safety efforts related to beef and its self-life.
The global food and beverage sector is subject to stringent safety requirements and a considerable part of the responsibility lies with food producers. As such, access to rapid testing technologies will enable the producers to fulfill their safety obligations without compromising on productivity and bottom lines. The consistent development of PCR-based tools will certainly outline the gradual progress of food pathogen testing industry, keeping in mind the high penetration of dairy and processed meat products worldwide.
Boxed macaroni and cheese—comforting, easy, and, according to a 2017 article by The New York Times, containing “high concentrations” of “[p]otentially harmful chemicals.” Roni Caryn Rabin, The Chemicals in Your Mac and Cheese, N.Y. TIMES, June 12, 2017. Those “chemicals” referenced by the Times are phthalates—versatile organic compounds that have been the focus of increased media, advocacy, and regulatory scrutiny. But what are phthalates and what is the litigation risk to food companies who make products that contain trace amounts of this material?
Background
Phthalates are a class of organic compounds that are commonly used to soften and add flexibility to plastic.1 Ninety percent of phthalate production is used to plasticize polyvinyl chloride (PVC).2 Di-(2-ethylhexl) phthalate (DEHP) is the most commonly used phthalate plasticizer for PVC.3 Due to the prevalence of plastics in the modern world, phthalates are everywhere—from food packaging to shower curtains to gel capsules. Consequently, almost everyone is exposed to phthalates almost all of the time and most people have some level of phthalates in their system.4
Recently, various epidemiological studies have purported to associate phthalates with a range of different injuries, from postpartum depression to obesity to cancer. However, as the Agency for Toxic Substances and Disease Registry (ATSDR) stated in its 2019 toxicology profile for DEHP, these epidemiology studies are flawed because, inter alia, they often rely on spot urine samples to assess exposure, which does not provide long-term exposure estimates or consider routes of exposure.5 To date, claims regarding the effects of low-level phthalate exposure on humans are not supported by human toxicology studies. Instead, phthalate toxicology has only been studied in animals, and some phthalates tested in these animal studies have demonstrated no appreciable toxicity. Two types of phthalates—DBP and DEHP—are purported to be endocrine disrupting (i.e., affecting developmental and reproductive outcomes) in laboratory animals, but only when the phthalates are administered at doses much higher than those experienced by humans.6 Indeed, there is no causal evidence linking any injuries to the low-level phthalate exposure that humans generally experience. Nonetheless, advocacy and government groups have extrapolated from these animal studies to conclude that DEHP may possibly adversely affect human reproduction or development if exposures are sufficiently high.7 Indeed, in the past two decades, a number of regulatory authorities began taking steps to regulate certain phthalates. Most notably:
In 2005, the European Commission identified DBP, DEHP, and BBP as reproductive toxicants (Directive 2005/84/EC), and the European Union banned the use of these phthalates as ingredients in cosmetics (Directive 2005/90/EC).
In 2008, Congress banned the use of DBP, DEHP, and BBP in children’s toys at concentrations higher than 0.1%. See 15 U.S.C. § 2057c.
The EU added four phthalates (BBP, DEHP, DBP, and DIBP) to the EU’s list of Substances of Very High Concern (SVHCs) and, subsequently, to its Authorization List, which lists substances that cannot be placed on the market or used after a given date, unless authorization is granted for specific uses. BBP, DEHP, DBP, and DIBP were banned as of February 21, 2015, except for the use of these phthalates in the packaging of medicinal products.
In 2012, the FDA issued a statement discouraging the use of DBP and DEHP in drugs and biologic products. At the time, the agency said that these phthalates could have negative effects on human endocrine systems and potentially cause reproductive and developmental problems.8
More recently, phthalate exposure through food has become a trending topic among consumer advocates. Phthalates are not used in food, but can migrate into food through phthalates-containing materials during food processing, storing, transportation, and preparation. Certain studies report that ingestion of food accounts for the predominant source of phthalate exposure in adults and children. However, in assessing DEHP, the ATSDR noted that the current literature on “contamination of foodstuffs comes from outside the United States or does not reflect typical exposures of U.S. consumers; therefore, it is uncertain whether and for which products this information can be used in U.S.-centered exposure and risk calculations.”9 Further, the concentration of phthalates found in food are very low-level—multiples lower than the doses used in animal toxicology studies.10
In 2017, a study published on the advocacy site “kleanupkraft.org” stated that phthalates were detected in 29 of 30 macaroni and cheese boxes tested.11 The study notes that “DEHP was found most often in the highest amounts.” Notably, however, the “amounts” are provided without any context, likely because there is no universally accepted threshold of unsafe phthalate consumption. Thus, although the boxed macaroni and cheese study found “that DEHP, DEP, DIBP, and DBP were frequently detected in the cheese items tested,” and “[t]he average DEHP concentration was 25 times higher than DBP, and five times higher than DEP,” none of this explains whether these numbers are uniquely high and/or dangerous to humans. Meanwhile, on December 10, 2019, the European Food Safety Authority announced an updated risk assessment of DBP, BBP, DEHP, DINP, and DIDP, and found that current exposure to these phthalates from food is not of concern for public health.12
Phthalate Litigation
For years, phthalates in food have been targeted by environmental groups seeking to eliminate use of phthalates in food packaging and handling equipment. Most recently, several lawsuits were filed against boxed macaroni and cheese manufacturers alleging misrepresentation and false advertising due to their undisclosed alleged phthalate contamination. See, e.g., McCarthy, et al. v. Annie’s Homegrown, Inc., Case No. 21-cv-02415 (N.D. Cal. Apr. 2, 2021). Perhaps acknowledging that the amounts contained in the food packages have not been shown to present any danger, these claims are being pursued as consumer fraud claims based on failure to identify phthalates as an ingredient, rather than as personal injury claims.
Besides this recent litigation, however, there has been a notable dearth of phthalate litigation. This is likely due to several factors: First, in general, courts have rejected false claim lawsuits involving trace amounts of a contaminant chemical. See, e.g., Tran v. Sioux Honey Ass’n, Coop., 471 F. Supp. 3d 1019, 1025 (C.D. Cal. 2020) (collecting cases). For example, in Axon v. Citrus World, Inc., 354 F. Supp. 3d 170 (E.D.N.Y. 2018), the Court dismissed plaintiff’s claim that the use of the word “natural” constituted false advertising because the product contained trace amounts of weed killer. Id. at 182–84. The Court based this dismissal, in part, on the fact that the trace amounts of the commonly used pesticide was “not an ‘ingredient’ added to defendant’s products; rather, it is a substance introduced through the growing process.” Id. at 183. Similarly, phthalate is not an intentionally added ingredient—instead, it is a substance introduced, if at all, in trace amounts at various points throughout the manufacturing, handling, and packaging process. Second, proving that phthalate exposure from a particular food item caused an alleged injury would be extremely difficult. As mentioned above, there is no direct scientific evidence linking low-level phthalate exposure in humans to reproductive problems, cancer, or any other injury. Instead, plaintiffs must rely on animal studies where the subject, most commonly a rat, was exposed to enormous amounts of phthalates, many multiples of the amount that would be found in food. Moreover, the pervasive nature of phthalates makes it difficult to pinpoint any particular product as the source of the injury. If every food item a plaintiff ever consumed has been touched by a phthalate-containing material, it seems near impossible to prove that one particular food caused the alleged injury.
Although phthalate litigation has thus far proven unpopular, this landscape could change in the near future due to increased regulatory scrutiny. On December 20, 2019, the EPA stated that DEHP, DIBP, DBP, BBP, and dicyclohexyl phthalate were five of 20 high-priority chemicals undergoing risk evaluation pursuant to the Toxic Substances Control Act.13 The categorization of these phthalates as high-priority initiates a three- to three-and-a-half-year risk evaluation process, which concludes in a finding of whether the chemical substance presents an unreasonable risk of injury to health or the environment under the conditions of use.14 Although the same causation and product identification issues will remain, a revised risk analysis by the EPA may lead to increased phthalate litigation.
The views expressed in this article are exclusively those of the authors and do not necessarily reflect those of Sidley Austin LLP and its partners. This article has been prepared for informational purposes only and does not constitute legal advice. This information is not intended to create, and receipt of it does not constitute, a lawyer-client relationship. Readers should not act upon this without seeking advice from professional advisers.
References
The most commonly used phthalates are di-(2-ethylhexyl) phthalate (DEHP), diisononyl phthalate (DINP), benzyl butyl phthalate (BBP), di-n-butyl phthalate (DBP), and diethyl phthalate (DEP). See Angela Giuliani, et al., Critical Review of the Presence of Phthalates in Food and Evidence of Their Biological Impact, 17 INT. J. ENVIRON. RES. PUBLIC HEALTH 5655 (2020).
COWI A/S, Data on Manufacture, Import, Export, Uses and Releases of Dibutyl Phthalate (DBP), As Well As Information on Potential Alternatives To Its Use 10-11 (Jan. 29, 2009). http://echa.europa.eu/documents/10162/
13640/tech_rep_dbp_en.pdf (observing European Council for Plasticizers and Intermediates (ECPI)); Agency for Toxic Substances & Disease Registry, DI-n-BUTYL PHTHALATE, Production, Import/Export, Use, and Disposal (Jan. 3, 2013). http://www.atsdr.cdc.gov/ToxProfiles/tp135-c5.pdf; Peter M. Lorz, et al., Phthalic Acid and Derivatives. ULLMANN’S ENCYCLOPEDIA OF INDUSTRIAL CHEMISTRY (Wiley-VCH: Weinheim, 2000); Lowell Center for Sustainable Production, Phthalates and Their Alternatives: Health and Environmental Concerns 4 (Jan. 2011). https://www.sustainableproduction.org/downloads/PhthalateAlternatives-January2011.pdf.
Michael D. Shelby, NTP-CERHER Monograph on the Potential Human Reproductive and Developmental Effects of Di (2-Ethylhexyl) Phthalate (DEHP). National Toxicology Program, HHS. NIH Publication No. 06-4476 at 2–3 (Nov. 2006).
FDA Guidance for Industry. Limiting the Use of Certain Phthalates as Excipients in CDER-Regulated Products. HHS, FDA. (Dec. 2012).
Toxicology Profile for Di(2-Ethylhexyl) Phthalate (DEHP) at 362, supra n.5.
Compare id. at 5 (measuring effects of phthalate oral exposure in mg/kg/day) with Samantha E. Serrano, et al., Phthalates and diet: a review of the food monitoring and epidemiology data, 13 ENVIRON. HEALTH 43 (2014) (measuring phthalate concentration in food in μg/kg).
The COVID-19 pandemic heightened the urgency for food brands to adopt technology solutions that support remote management of environmental monitoring programs (EMPs) as they strive to provide safe products to customers. While digital transformation has progressed within the food safety industry, food and beverage manufacturers often have lower profitability as compared to other manufacturing industries, such as pharmaceutical and high-tech equipment, which can lead to smaller IT spend.1 Many companies still rely on manual processes for environmental monitoring and reporting, which are prone to error, fail to provide organizations with visibility into all of their facilities and limit the ability to quickly take corrective actions.
Despite growing recognition of the value of automating testing, diagnostics, corrective actions and analytic workflows to prevent contamination issues in food production environments, barriers to adoption persist. One key obstacle is the recurring mindset that food safety is a necessary compliance cost. Instead, we need to recognize that EMP workflow automation can create real business value. While the downside of food safety issues is easy to quantify, organizations still struggle to understand the upside, such as positive contributions to productivity and a stronger bottom-line achieved by automating certain food safety processes.
To understand how organizations are using workflow automation and analytics to drive quantifiable business ROI, a two-year study that included interviews and anonymized data collection with food safety, operations, and executive leadership at 34 food organizations was conducted.
The respondents represent more than 120 facilities using advanced EMP workflow automation and analytics. Based on the interviews and the shared experience of food organization leaders, two key examples emerged that demonstrate the ROI of EMP automation.
Improved Production Performance
According to those interviewed, one of the primary benefits of EMP automation (and driver of ROI) is minimizing production disruptions. A temporary conveyor shutdown, unplanned cleaning, or extensive investigatory testing can add up to an astounding 500 hours annually at a multi-facility organization, and cost on average $20,000 to $30,000 per hour.2 So, it’s obvious that eliminating costly disruptions and downtime has a direct impact on ROI from this perspective.
But organizations with systems where information collected through the EMP is highly accessible have another advantage. They are able to take corrective actions to reduce production impacts very quickly. In some cases, even before a disruption happens.
By automatically feeding EMP data into an analytics program, organizations can rapidly detect the root cause of issues and implement corrective actions BEFORE issues cause production delays or shutdowns.
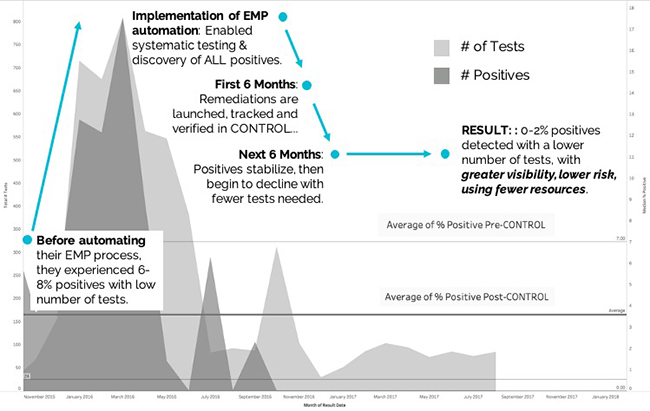
In one example, over the course of several months, a large dairy company with manual EMP processes automated its food safety workflows, improved efficiencies, reduced pathogen positives and improved its bottom line. At the start of the study, the company increased systematic pathogen testing schedules to identify where issues existed and understand the effectiveness of current sanitation efforts. With improved access to data on testing, test types and correlated sanitation procedures, the company was able to implement a revamped remediation program with more effective corrective action steps.
Ultimately, the automated workflows and analytics led to reduced positive results and more efficient EMP operations for the company as compared to the “crisis-mode” approach of the past. The associated costs of waste, rework, delayed production starts, and downtime caused by food safety issues were significantly reduced as illustrated in Figure 1.
Figure 1: Reduction of food safety testing costs through EMP automation. Customer Study 2016-2018. All figures courtesy of Corvium, Inc.
Quantifying the ROI of Production Performance Improvements
The financial impact of reducing production downtime by just 90 minutes per week can be dramatic when looked at by cumulative results over multiple weeks. In fact, eliminating just a few delayed starts or unplanned re-cleaning can have significant financial gains.
Figure 2 shows the business impact of gaining 90 minutes of production up-time per week by automating food safety operations. For the purposes of this analysis, the “sample organization” depicted operates two facilities where there are assumptions that down-time equates to a cost value of $30,000 per hour, and that both plants experience an average of 90 minutes of downtime per week that can be re-gained.
Figure 2: Sample Production Performance Improvement ROI Calculation.
Reduced Food Waste
The second key insight uncovered in the two-year study was the impact that automating the EMP process had on waste. An estimated 30–40% of all food produced in the United States is wasted, and preventable food safety and quality issues account for a substantial portion of this waste.3
A key challenge shared by study participants was detecting food safety issues early enough to avoid wasting an entire production run. Clearly, the later in a processing or manufacturing run that issues are discovered, the greater the potential waste. To limit this, organizations needed near real-time visibility into relevant food safety and EMP data.
By automating EMP workflows, they solved this issue and created value. By tracking and analyzing data in near real time, production teams were able to keep up with ever-moving production schedules. They could define rules to trigger the system to automatically analyze diagnostic results data and alert stakeholders to outliers. Impacted food product could be quickly identified and quarantined when needed before an entire production run was wasted.
Companies included in the study realized substantial benefits from the increased efficiencies in their testing program. According to a food safety quality assurance manager at a large U.S. protein manufacturer, “Our environmental monitoring program has reached new heights in terms of accuracy, communication, visibility and efficiency. Manual, time-intensive tasks have been automated and optimized, such as the ability to search individual sample or submittal IDs, locate them quickly and make any necessary changes.”
Quantifying the ROI of Food Waste Reductions
Figure 3 shows how measuring the business impact of gaining back just 10% of scrapped food per week. For the purposes of this analysis, the “sample organization” depicted operates two facilities where there are 500 lbs. of finished product scrapped each week, and the value per pound of finished product is valued at a cost of $1 per pound.
Figure 3. Sample Waste Reduction ROI Calculation.
Conclusion
Automating EMP workflows decreases the time required to receive and analyze critical EMP data, helping food manufacturers achieve significant improvements in production performance, waste reduction and overall testing efficiency. By using these same ROI calculations, food brands can better illustrate how improved food safety processes can build value, and help leaders see food safety as a brand imperative rather than a cost center. As food organizations progress through each stage of digital transformation, studies like this can show real-world examples of business challenges and how other organizations uncovered value in adoption of new technologies and tools.
Vitamins play a critical role in the regulation of key physiological processes, such as blood clotting, metabolism and maintaining our vision. These biologically important compounds can be divided into two broad classes based on their solubility and differ in the way they are handled in the body—and in food safety laboratories. While excess amounts of water-soluble vitamins (including B1, B2, B3, B6 and B12) are excreted, fat-soluble vitamins (including vitamin A, D, E and K) can be stored in the liver or fatty tissue for later use. The simultaneous analysis of water- and fat-soluble vitamins in traditional liquid chromatography is difficult, and is compounded by the presence of biologically important vitamin isomers, which exist at lower concentrations and demand greater sensitivity from analytical techniques.
Food analysis laboratories support food manufacturers by assessing food safety and authenticity, and have a responsibility to produce precise and reliable data. Vitamins are among a number of compounds assessed in infant formulas, energy drinks and other supplements, and are added to fortify the nutritional value of these products. Given the critical nutritional role of vitamins, especially during early developmental periods, their characterization is highly important. This, along with the challenging and cumbersome nature of vitamin analysis, has spurred the development of innovative high-performance liquid chromatography (HPLC) methods for food safety testing.
Unique Challenges of Vitamin Analysis
The simultaneous analysis of water- and fat-soluble vitamins is difficult to achieve with reversed-phase high-performance liquid chromatography, due to the wide range of hydrophobicity among vitamins. Highly hydrophobic fat-soluble vitamins are retained strongly by chromatography columns and are only eluted with high-strength mobile phases. In contrast, water-soluble vitamins are usually poorly retained, even with very weak mobile phases. As the ideal conditions for chromatographic separation are very different for the two vitamin classes, there have been efforts to explore the possibility of operating two columns sequentially in one system. The early versions of this approach, however, were not well suited to high-throughput food safety laboratories, requiring complex hardware setup and even more complicated chromatography data system programming.
Prior to liquid chromatography analysis, food samples must be purified and concentrated to ensure target analytes can be detected without matrix interference. Liquid-liquid extraction is one purification method used to prepare for the analysis of vitamins and other compounds; it was one of the first methods developed for purification and enables compounds to be separated based on their relative solubilities in two different immiscible liquids.1 It is a simple, flexible and affordable method, yet has several major disadvantages.2 Liquid-liquid extraction consists of multiple tedious steps and requires the use of large volumes, therefore the time for completion is highly dependent on the operator’s skills and experience. Consequently, the duration of sample exposure to unfavorable conditions can vary greatly, which compromises reproducibility and efficiency of the method. This is of concern for vitamins that are particularly prone to degradation and loss when exposed to heat and light, such as vitamin D in milk powder.
Two-Dimensional Liquid Chromatography Enables Deeper and Faster Analysis
Analysts in the food industry are under pressure to process high volumes of samples, and require simple, high-throughput and high-resolution systems. Fortunately, two-dimensional liquid chromatography (2D-LC) systems have evolved markedly in recent years, and are ideally suited for the separation of vitamins and other compounds in food and beverages. There are two main types of systems, known as comprehensive and heart-cutting 2D-LC. In comprehensive 2D-LC, the sample is separated on the first column, as it would be in 1D-LC. The entire eluate is then passed in distinct portions into a second column with a different selectivity, enabling improved separation of closely eluting compounds. In contrast, heart-cutting 2D-LC is more suited to targeted studies as only a selected fraction (heart-cut) of the eluate is transferred to the second-dimension column.
Recently, another novel approach has emerged which utilizes two independent LC flow paths. In dual workflows, each sample is processed by two columns in parallel, which are integrated in a single instrument for ease of use. The columns may offer identical or different analyses to enable a higher throughput or deeper insights on each sample. This approach is highly suited to vitamin analysis, as the two reversed-phase columns enable simultaneous analysis of water- and fat-soluble vitamins. A simple, optimized preparation method is required for each of the two vitamin classes to ensure samples are appropriately filtered and concentrated or diluted, depending on the expected amount of analyte in the sample. The dual approach enables a broad range of ingredients to be assessed concurrently in supplement tablets, energy drinks, and other food and beverages containing both water- and fat-soluble vitamins. For analysts working to validate claims by food vendors, these advances are a welcome change.
Refined Detection and Extraction Methods Create a Boost in Productivity
Analysts in food analysis laboratories now have a better ability to detect a wide range of components in less time, due to improved detection and extraction methods. Modern LC systems utilize a wide range of analytical detectors, including:
Mass spectrometry (MS)
Diode array detection (DAD)
Multi-wavelength detection
Charged aerosol detection (CAD)
Fluorescence detection (FLD)
The optimal detector technology will depend on the molecular characteristics of the target analyte. Infant formula, for example, can be analyzed by DAD and FLD, with detection and separation powerful enough to accurately quantify the four isomers of vitamin E, and separate vitamin D2 and D3. Highly sensitive 2D-LC methods are also particularly favorable for the trace level quantitation of toxins in food, such as aflatoxins in nuts, grains and spices.
Given the limitations of liquid-liquid extraction, an alternative, simplified approach has been sought for 2D-LC analysis. Liquid-liquid extraction, prior to chromatography analysis, involves many tedious separation steps. In contrast, the use of solid phase extraction for infant formula testing reduces pre-treatment time from three hours to one hour, while improving detection. This is of great significance in the context of enterprise product quality control, where a faster, simpler pre-treatment method translates into a greater capacity of product testing and evaluation.
HPLC Toolkit for Food Safety Analysis Continues to Expand
Several other HPLC approaches have also been utilized in the field of food safety and authentication. For example, ultra-high-performance liquid chromatography (UHPLC) with detection by CAD followed by principal component analysis (PCA) can be used to investigate olive oil purity. In contrast to conventional approaches (fatty acid and sterol analysis), this revised method requires very little time and laboratory resources to complete, enabling companies to significantly reduce costs by implementing in-house purity analysis. With a reduced need for chemicals and solvents compared with fatty acid and sterol analyses, UHPLC-CAD provides a more environmentally friendly alternative.
Analyzing amino acid content in wine is an important aspect of quality control yet requiring derivatization to improve retention and separation of highly hydrophilic amino acids. Derivatization, however, is labor-intensive, error-prone, and involves the handling of toxic chemicals. To overcome these limitations, hydrophilic interaction liquid chromatography (HILIC) combined with mass detection has been identified as an alternative method. While HILIC is an effective technique for the separation of small polar compounds on polar stationary phases, there still may be cases where analytes in complex samples will not be completely separated. The combination of HILIC with MS detection overcomes this challenge, as MS provides another level of selectivity. Modern single quadrupole mass detectors are easy to operate and control, so even users without in-depth MS expertise can enjoy improved accuracy and reproducibility, while skipping derivatization steps.
Conclusion
Recent innovations in 2D- and dual LC technology are well suited to routine vitamin analysis, and the assessment of other components important in food safety evaluation. The concurrent and precise assessment of water- and fat-soluble vitamins, despite their markedly different retention and elution characteristics, is a major step forward for the industry. Drastic improvements in 2D-LC usability, flexibility and sensitivity also allows for biologically important vitamin isomers to be detected at trace levels. A shift towards simpler, high-throughput systems that eliminate complicated assembly processes, derivatization and liquid-liquid extraction saves time and money, while enabling laboratories to produce more reliable results for food manufacturers. In terms of time and solvent savings, solid phase extraction is superior to liquid-liquid extraction and is one of many welcome additions to the food analysis toolkit.
References
Schmidt, A. and Strube, J. (2018). Application and Fundamentals of Liquid-Liquid Extraction Processes: Purification of Biologicals, Botanicals, and Strategic Metals. In John Wiley & Sons, Inc (Ed.), Kirk-Othmer Encyclopedia of Chemical Technology. (pp. 1–52).
Musteata, M. and Musteata, F. (2011). Overview of extraction methods for analysis of vitamin D and its metabolites in biological samples. Bioanalysis, 3(17), 1987–2002.
This website uses cookies so that we can provide you with the best user experience possible. Cookie information is stored in your browser and performs functions such as recognising you when you return to our website and helping our team to understand which sections of the website you find most interesting and useful.
Strictly Necessary Cookies
Strictly Necessary Cookies should be enabled at all times so that we can save your preferences for these cookie settings.
We use tracking pixels that set your arrival time at our website, this is used as part of our anti-spam and security measures. Disabling this tracking pixel would disable some of our security measures, and is therefore considered necessary for the safe operation of the website. This tracking pixel is cleared from your system when you delete files in your history.
We also use cookies to store your preferences regarding the setting of 3rd Party Cookies.
If you visit and/or use the FST Training Calendar, cookies are used to store your search terms, and keep track of which records you have seen already. Without these cookies, the Training Calendar would not work.
If you disable this cookie, we will not be able to save your preferences. This means that every time you visit this website you will need to enable or disable cookies again.
Cookie Policy
A browser cookie is a small piece of data that is stored on your device to help websites and mobile apps remember things about you. Other technologies, including Web storage and identifiers associated with your device, may be used for similar purposes. In this policy, we say “cookies” to discuss all of these technologies.
Our Privacy Policy explains how we collect and use information from and about you when you use This website and certain other Innovative Publishing Co LLC services. This policy explains more about how we use cookies and your related choices.
How We Use Cookies
Data generated from cookies and other behavioral tracking technology is not made available to any outside parties, and is only used in the aggregate to make editorial decisions for the websites. Most browsers are initially set up to accept cookies, but you can reset your browser to refuse all cookies or to indicate when a cookie is being sent by visiting this Cookies Policy page. If your cookies are disabled in the browser, neither the tracking cookie nor the preference cookie is set, and you are in effect opted-out.
In other cases, our advertisers request to use third-party tracking to verify our ad delivery, or to remarket their products and/or services to you on other websites. You may opt-out of these tracking pixels by adjusting the Do Not Track settings in your browser, or by visiting the Network Advertising Initiative Opt Out page.
You have control over whether, how, and when cookies and other tracking technologies are installed on your devices. Although each browser is different, most browsers enable their users to access and edit their cookie preferences in their browser settings. The rejection or disabling of some cookies may impact certain features of the site or to cause some of the website’s services not to function properly.
Individuals may opt-out of 3rd Party Cookies used on IPC websites by adjusting your cookie preferences through this Cookie Preferences tool, or by setting web browser settings to refuse cookies and similar tracking mechanisms. Please note that web browsers operate using different identifiers. As such, you must adjust your settings in each web browser and for each computer or device on which you would like to opt-out on. Further, if you simply delete your cookies, you will need to remove cookies from your device after every visit to the websites. You may download a browser plugin that will help you maintain your opt-out choices by visiting www.aboutads.info/pmc. You may block cookies entirely by disabling cookie use in your browser or by setting your browser to ask for your permission before setting a cookie. Blocking cookies entirely may cause some websites to work incorrectly or less effectively.
The use of online tracking mechanisms by third parties is subject to those third parties’ own privacy policies, and not this Policy. If you prefer to prevent third parties from setting and accessing cookies on your computer, you may set your browser to block all cookies. Additionally, you may remove yourself from the targeted advertising of companies within the Network Advertising Initiative by opting out here, or of companies participating in the Digital Advertising Alliance program by opting out here.