The Raw Facts on Raw Milk Safety

By Wilfredo Dominguez Nunez, Ph.D.
No Comments

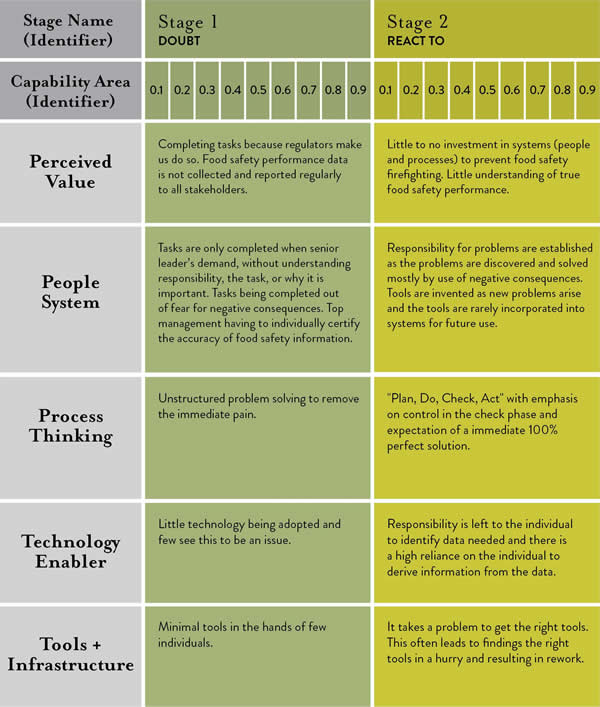
Based on prevalent blog posts and advocacy organizations claiming benefits for raw milk consumption (ranging from alleviating lactose intolerance to treating cancer) and the fact that milk in general has become a growing staple of the American diet, one would surmise that non-pasteurized or homogenized milk is the biggest thing to hit the kitchen since the sliced bread you might pair with it.

However, in reality, it is estimated that less than 1% of U.S. milk production is consumed raw. 1,6,8 Government agencies, in fact, advise against its consumption.2 Yet despite its supporters, raw milk continues to be a topic of heated debate on news channels and social media.

Outbreaks associated with raw milk consumption are disproportionally more common in a per-pound-consumed basis compared to outbreaks associated with pasteurized milk.6 During the period between 1993 and 2006, 121 outbreaks were traced back to dairy products. From those cases, raw dairy products were responsible for 73 outbreaks, 1,575 ill individuals, 202 hospitalizations, and two deaths. Comparatively, pasteurized products were responsible for 48 outbreaks, 2,842 ill individuals, 37 hospitalizations, and one death. In a per-pound-consumed basis, raw milk products were responsible for at least 100 times more outbreaks, ill persons, hospitalizations and deaths than the pasteurized products.

Advocates of raw milk, who believe that conventional processing used in pasteurized milk (heat treatment, homogenization, etc.) impedes the health benefits stated above, suggest that good practices alone can guarantee a safe supply of raw milk. Certainly, due to the lack of a heat treatment, raw milk safety relies exclusively on proper production, transportation and storage practices. These practices are now part of a well-established set of standard operating procedures that yield high-quality milk. In the United States, the Grade A Pasteurized Milk Ordinance (PMO), published by the Food and Drug Administration, defines minimum sanitary conditions for which milk is acceptable for fluid consumption, and most dairy farms today produce milk with total bacterial counts significantly below the 10,000 colony forming units per milliliter (CFU/ml) minimum standard.7,9 In fact, under excellent management and milking conditions the counts can reach levels below 1,000 CFU/ml.7

Based on these numbers, the United States probably has one of the safest and highest quality milk supplies in the world. However, even under these regulated farming, milking, storing and transporting conditions, human pathogens have often been detected from milking facilities around the country in several independent studies.7 L. monocytogenes has been found in up to 12.6% of milking facilities, and its infection can be fatal. Salmonella spp., which has shown 6.1% prevalence in milking facilities, can produce severe gastrointestinal distress and death. Pathogenic E. coli infection is able to produce permanent kidney damage and death. This pathogen has been found in up to 4% of surveyed dairy farms.

The fact is that milk, as a nutritious and close-to-neutral pH food, is a good medium for the growth of these and other pathogens, and some pathogens (i.e., L. monocytogenes) are capable of growing at the refrigerated temperatures in which milk is stored.5 An additional and extremely important factor is that it only takes a few cells—sometimes as low as 10, according to estimates—to cause an infection.5

Microbial Testing: Not all Tests and Samples are Alike

Some believe that successful microbial testing of raw milk render it as safe to consume. Although testing is a powerful tool for food safety, producers and consumers should know that it is highly dependent on the quality of the sample taken and the information that the particular microbial test can provide.

Coliform testing serves as a good example. Commonly used to assess the level of potential fecal contamination in a sample, this microbial test is performed by using a selective medium that inhibits the growth of many microorganisms and allows the growth of other organisms, namely those found in the intestinal tract of warm-blooded animals like cattle and humans, at a defined temperature.4 Therefore, although the levels of these organisms give an indication of the sanitary conditions in which the milk was produced, there are still many pathogens that will be overlooked by a coliform test, as they will not grow under the conditions described.

In addition, end-product testing for pathogens provides a limited amount of information since very low levels could be present, and the contamination might not be homogeneous. Testing is only valuable as part of an integral food safety strategy that has been validated to reduce the risk of pathogens under the conditions that the milk is produced. Otherwise, tests results have little to no value.

Petrifilm Plate Use on Milk Samples

In recent months, some advocacy organizations have claimed that raw milk is safe to consume after being successfully tested on Petrifilm Plates, a testing technology that has become a staple within the food industry, including dairy processing, for more than 30 years. It has long been recognized as an official method by the AOAC International Official Methods of Analysis.

Petrifilm Plate technology is available for several tests that can assess the quality and safety of milk as well as the environment in which it was produced. However, it is important to understand that any given test provides limited information regarding the type of organisms in the sample. Therefore, multiple indicator tests must be used to more fully characterize the microorganisms present. It is also critical to keep in mind that no test can substitute good production practices and that, statistically speaking, outbreaks associated with raw milk have been much greater than pasteurized milk.

Environmental testing is arguably more important than end-product testing, as the environment is often the source of contamination. A quality and safety program should include a strong environmental sampling component. Environmental samples can be collected using a sponge for large surfaces or swab for hard-to-reach areas. Collected samples can then be “plated” to the aerobic count plate (a 48-hour test) or rapid aerobic count plate (a 24-hour test) to conduct a standard plate count, also known as aerobic plate count, which gives a general indication of the microbial load in a product or environment. The test is conducted in non-selective medium that allows the growth of a wide range of bacteria that can then be visualized and enumerated (counted). Therefore, it provides an initial gauge of the sanitary conditions of the food product and the environment in which it is produced. The results can be reported as CFU per unit of volume (milliliter, ml), weight (gram, g) or surface (square centimeter, cm2) depending on the type of sample tested. In the United States, Grade A milk must have a microbial load less than 100,000 CFU/ml for raw and must be below 20,000 CFU/ml after pasteurization. In addition, the PMO also includes specifications for bacterial loads of single-service containers and closures.

Figure 1. Raw milk sample plated onto A) 3M Petrifilm Rapid Aerobic Count incubated for 24 hours and B) Standard Methods Agar incubated at 48 hours.

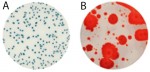
For raw milk, the time to results and the ease of reading makes the Petrifilm Rapid Aerobic Count Plate an ideal testing tool. Launched in early 2015, it harbors a dual-sensing indicator technology that yields blue/green and red colonies to facilitate enumeration. In addition, this plate was engineered with technology that resists distortion often caused by spreader colonies (see Figure 1).

Coliform Counts Too

Visualizing the microorganisms identified with the standard plate count is not enough. More testing is needed to suggest the presence of fecal contamination. The term “fecal coliforms” is used to describe a sub-group of coliforms such as E. coli and Klebsiella spp that are differentiated by their ability to ferment lactose at high temperatures.3 Enumeration of E. coli is arguably the best routine indicator of fecal contamination. E. coli is rarely found growing in environments outside the intestine, although they are able to survive, and their enumeration is relatively simple and rapid. While the PMO has no coliform standard for raw milk, it states that the coliform count in pasteurized milk should not exceed 10 CFU/ml.

The Importance of a Comprehensive Safety and Quality Strategy

As discussion of raw milk expands and is promoted by several groups, the safety of the product becomes a more generalized issue. Similar to other ready-to-eat products, safe raw milk consumption depends on integrated systems that assess, monitor, validate and verify the process and environment in which processing, storing and distributing occurs. Yet unlike other ready-to-eat products, or pasteurized milk for that matter, raw milk lacks any intervention to reduce the microbial load present. Therefore, monitoring of this microbial load in product and environment is an important aspect of quality and safety.

However, it is important to understand that any kind of microbial testing is only significant when it is part of an integral, comprehensive safety and quality strategy. Test results alone cannot replace good practices or interventions designed to reduce microbial loads to acceptable levels were the occurrence of foodborne pathogens is less likely.

References

  1. Centers for Disease Control and Prevention. (2007). Foodborne Active Surveillance Network (FoodNet) Population Survey Atlas of Exposures, 2006-2007. Atlanta: U.S. Department of Health and Human Services, Centers for Disease Control and Prevention.
  2. Center for Disease Control and Prevention. “Raw Milk Questions and Answers”. Accessed March 2015. Retrieved from: http://www.cdc.gov/foodsafety/rawmilk/raw-milk-questions-and-answers.html.
  3. Eijkman, C. (1904). Die garungsprobe bei 46° als hilfsmittel bei der trinkwasseruntersuchung. Zentr. Bakteriol. Parasitenk. Abt. I. Orig. 37:742.
  4. Feng, P., Weagant, S.D., Grant, M.A., Burkhardt, W. (1998). Bacteriological Analytical Manual, 8th Edition, Revision A. Chapter 4 BAM: Enumeration of Escherichia coli and the Coliform Bacteria. Accessed March 2015. Retrieved from: http://www.fda.gov/Food/FoodScienceResearch/LaboratoryMethods/ucm064948.htm.
  5. Food and Drug Administration. (2012). Bad Bug Book, Foodborne Pathogenic Microorganisms and Natural Toxins.
  6. Langer, A.J., Ayers, T., Grass, J., Lynch, M., Angulo, F.J., Mahon, B.E. (2012). Nonpasteurized dairy products, disease outbreaks, and state laws—United States, 1993–2006. Emerg Infect Dis. 18(3):385–391.
  7. Oliver, S.P., Boor, K.J., Murphy, S.C., Murinda, S.E. (2009). Food safety hazards associated with consumption of raw milk. Foodborne Pathog Dis. 6:793-806.
  8. U.S. Department of Agriculture. “Milk production”. Accessed March 2015. Retrieved from: www.nass.usda.gov.
  9. U.S. Department of Health and Human Services, Public Health Service, Food and Drug Administration. Grade ‘‘A’’ Pasteurized Milk Ordinance, 2009 Revision.

Why LIMS Is a Necessity, Not a Nicety

By Dr. Christine Paszko
No Comments

How a laboratory information management system can facilitate safety testing and regulatory compliance within a food processor’s lab.

The food industry is under pressure to produce high-quality products while adhering to stringent microbiological testing standards controlling costs and meeting regulatory compliance goals. Food companies face a number of regulations and requirements, including those related to Good Manufacturing Practices, nutritional labeling, HACCP (Hazard Analysis and Critical Control Points), public health security, the Bioterrorism Preparedness and Response Act of 2002, and FSMA. For laboratories that offer products globally, the Global Food Safety Initiative focuses on continuous improvement of food safety management systems to ensure confidence in the delivery of safe food to consumers. Many companies face these regulatory challenges armed with a stable and secure laboratory information management system (LIMS) and laboratory automation solutions. LIMS solutions can provide a cost-effective means to ensure that product standards are met, product is delivered as quickly as possible, and managers and staff have the tools to effectively do their jobs. While there are many commercially available LIMS solutions, it is critical that laboratory managers perform due diligence to ensure that the system they select will be successful in the lab. Some ways in which an LIMS vendor can differentiate itself includes: having ISO 9001 certification offering a qualified staff, being a certified Microsoft Gold Partner, and offering software solutions based on the latest technology that allows users to leverage the Internet, tablets and smartphones.

Implementing an LIMS: The problem and the solution

A microbiology laboratory of a meat processor was looking for ways to eliminate transcription errors, and shorten its analysis turnaround time and reporting time through automation. The company was experiencing increasing sample volume, which would require hiring additional resources that had to be trained and deployed. However, taking on more personnel was not an option. To manage its growing sample volume, the company was seeking an LIMS that could also interface with its laboratory instruments and manage plant samples from multiple remote sites. An evaluation of current processes revealed multiple opportunities to automate data entry, reporting, and eliminate dual and triple entry while accelerating and automating data handling and test scheduling.

Samples, including raw materials, finished products and plant samples, were sent from multiple plants to the laboratory daily for environmental monitoring. The current manual system was labor intensive and required that all processes be manually checked and re-checked for accuracy prior to data release. Data was entered into the manual systems multiple times. Instrument data was not integrated with the reporting and the lab was increasing its sample volume for the instruments alone by up to 900 samples per day. Primary reasons for investing in LIMS automation included:

•    Having the ability to do more work with the same resources (removing manual tasks)
•    Enhancing data management into a single, secure data base
•    Meeting regulatory compliance goals
•    Operating under enhanced efficiency and data quality
•    Facilitation of standards and increased communication across their operations
•    Cost savings

Automation reduces transcription errors, increases productivity, enhances data quality and accelerates result delivery. Faster turnaround translates into faster product release, longer shelf-life and ultimately, cost savings.

Then: Prior to implementing the LIMS, samples would arrive at the food processor’s laboratory each morning. From there, they were manually sorted, paperwork was organized, and checks were conducted to verify receipt of samples.

Now: LIMS has significantly streamlined the process. Each morning, a work list is printed from the LIMS, identifying which samples will be received from the plants. The samples are organized and prepared for analysis and placed on the instruments with barcoded work lists for rapid and accurate set up.

The microbiology laboratory leveraged an automated food pathogen detection system to test for Listeria spp., Salmonella spp. and E.coli:0157:H7 on various sample types. Prior to automation, the manual steps of loading the sample IDs, scanning the print outs from the instruments, and then entering the data into reports with secondary review required 40 to 45 minutes per batch of 60 samples.

 Two of the four instruments interfaced with a LIMS.

Implementation of the LIMS has reduced report review time to five minutes. The data is received by the LIMS, and the email is automatically parsed and ready to receive the samples. The emailed worksheets, which are also automatically imported into the LIMS, eliminate several manual steps, including the time in which the laboratory team spent cross-checking samples with the paperwork and calling for missing samples. In this case, the automation has reduced the amount of paperwork and significantly streamlined the process. Now the laboratory knows which samples it will be receiving each day and can quickly match the samples to previously imported work lists.

Once the samples are loaded on the pathogen detection instrument to match the work list from the LIMS, the screening is conducted and the data is sent back to the LIMS, with the final analysis report completed automatically.

 
 An example of a final report automatically generated from the system, which is also automatically emailed.


Conclusion

Primary enhancements to implementing an LIMS include higher data quality and significant time savings (a conservative estimate: LIMS typically saves customers between 25-45% of time on their operations). On the instrument integration alone, the automation saved 35 to 40 minutes of work per batch (a batch contains 60 samples), and a typical day includes 10 to12 batches, or up to 720 test results per day. Conservatively, if we allot 35 minutes per batch and 10 batches per day, the time savings are nearly six     hours daily, and this is only from interfacing four instruments. Additional time savings are also realized as a result of reducing data errors.

An alternative solution to hiring additional staff to work in the lab involved examining the benefits of automation to leverage existing resources and allowing them to be more productive. This path eliminated mundane tasks and allowed existing lab staff to focus on the LIMS  (managing, tracking and organizing data) and automation (barcoding, scanning, instrument integration, automated email imports and automated reporting). Laboratory staff was trained on-site and received follow-up training at the LIMS Boot Camp. As a result, workflows were streamlined, sample throughput was accelerated, and the lab experienced faster turnaround times.

Other benefits of deploying a new LIMS in the laboratory include increasing data security, having an audit trail if any approved and validated results required a change, full traceability, facilitating standardization across the organization, reducing the amount of paper forms, and automating the release and reporting process.


About the Author

Dr. Christine Paszko has extensive expertise in LIMS, laboratory automation and food safety testing. She is currently the VP of Sales and Marketing at Accelerated Technology Laboratories, Inc., (ATL). Prior to joining ATL, she worked at Applied Biosystems. She was responsible for the creation, marketing and sales of molecular test kits that leveraged the TaqMan technology to detect major foodborne pathogens such as Salmonella, Listeria, and E. coli 0157.

Listeria Invasion – How is it Creeping into Our Beloved Foods?

By Traci Slowinski
1 Comment

As a result of several recent high-profile Listeria-related recalls, interest in the foodborne pathogen is increasing and food processors must take preventive measures to keep it out of facilities.

Listeria monocytogenes is a gram-positive bacteria. It has 13 serotypes, three of which have been associated with the vast majority of foodborne infections (called listeriosis). Although it is not a leading cause of foodborne illness, it is among the leading causes of death from foodborne illness. This hardy pathogen is salt tolerant, thrives in cold, moist environments and can grow under refrigeration temperatures. Listeria is found throughout our environment including in soil, water, sewage, decaying vegetation and even some animals. Its presence has most often been identified in foods such as raw or under-pasteurized milk, smoked fish, deli meats, soft cheeses and raw vegetables.

For a healthy individual, Listeria may cause mild symptoms or have no effect at all. Fever, muscle aches, nausea, vomiting and diarrhea are common signs of infection. For the e  immunocompromised (the very young or old, pregnant women, or adults with weakened immune systems), symptoms can be more severe and include septicemia and meningitis; in pregnant women, it can cause miscarriage. Symptom-onset ranges from a few hours to two–three days, with durations lasting from days to several weeks, depending on the severity of infection.

Keep Listeria Out of Your Plant

The first line of defense against Listeria contamination is to keep it out of a facility, but that may not always be possible, thus a Listeria prevention plan should be integrated into a company’s food safety program, considering the following areas:

    • Employees—can be brought in on shoes and clothing, or through infected workers. Prevention includes:
      • Good Manufacturing Practices
        • Personnel Hygiene—proper hand washing, wearing clean clothes and shoes, wearing proper hair restraints
        • Employee Illness Policy—restriction/exclusion of ill employees
    • Raw Materials—introduction into the environment from raw ingredients (milk, fish, seafood, produce), pallets, cardboard, packaging material. Prevention includes:
      • Supply Chain Management
        • Supplier Approval Program—having strategic partners that ensure only safe, high-quality raw materials
        • Ingredient Management—requesting COAs, letters of guarantee, allergen control
        • Receiving/Storage Procedures—completing incoming inspections, proper nonconforming material handling
    • Processing Aids—harborage in ice, brine solutions, improperly filtered compressed air and HVAC units. Prevention includes:
      • Sanitation Program—proper cleaning/sanitizing of equipment
      • Preventative Maintenance—regular replacement/maintenance on filters/motors
      • Water, Air, and Steam—utilizing potable water, properly filtered air, properly treated steam
    • Equipment Design—contamination of conveyor belts, filling and packaging equipment, slicers/dicers, ice makers, hoses, equipment framework, condensate drip pans, maintenance tools, trash cans, tools for cleaning equipment (brushes and scouring pads). Prevention includes:
      • Sanitary Equipment Design – ensuring that all equipment can be broken down as far as possible and properly cleaned and sanitized to remove dirt, debris and micro-organisms
    • Process Flow—not maintaining segregation of high vs. low risk, clean vs. dirty. Prevention includes:
      • Separation of high-risk vs low-risk areas through time, space or physical barriers
      • Proper garb (smocks, hair restraints, captive shoe policy) and sanitary measures (hand wash and sanitize, shoe sanitizer) to reduce introduction into high-risk areas
      • Proper personnel flow or movement to prevent cross-contamination
    • Plant Environment—common pathogen harborage areas. Prevention includes:
      • Floors/Drains – splash back, biofilms
      • Overhead Structures – condensate, dust/debris
      • Waste Areas – trash buildup
      • Wash Areas – standing water
    • Sanitation Program—insufficient cleaning/sanitizing to remove pathogens. Prevention includes:
      • SSOP’s – comprehensive sanitation SOPs with special focus on hard-to-clean areas and equipment.
      • Drain Cleaning—proper frequency, chemicals and procedures
      • Clean-In-Place Systems—accessibility to hard-to-reach areas
      • Sanitizing Agents—quaternary ammonium compounds, peroxyacetic acid sanitizers (for biofilms)
    • Environmental Monitoring Program—tool to identify gaps and risk used improperly resulting in missed problems. Prevention includes:
      • Robust Sampling Plan—identify zones and sampling areas
      • Effective Track & Trend Tool—identify gaps or risk that require corrective/preventive action
      • Timely Corrective Action— ensure proper follow-up on any issues that arise

First Person: The Listeria Experience and Lessons Learned

The above list is by no means exhaustive when it comes to all the areas you need to consider when completing a gap analysis within your facility. Listeria can be very insidious, and you will need to be ever-vigilant to ensure it does not take hold in your environment. Believe me, I have been there when it has.

Once upon a time, I worked for a Ready-to-Eat processing plant. We had robust food safety and quality assurance programs. We employed two microbiologists and had a good environmental monitoring program. The sanitation team did a thorough job of cleaning and sanitizing every night, and we completed preoperational sanitation inspections (including ATP testing) every morning.

Then we had a Listeria recall.

It started out small. One sample tested by FDA came back positive. Then another…and another. More intensive environmental testing found Listeria in the plant—in the drains, in the hard to reach areas of the old slicers and MAP packaging equipment, and even in the production room cooling units.

After many, many hours of cleaning, sanitizing, testing and retesting, we determined that the current layout of the facility would never allow for complete elimination of the Listeria. We had one big production room where raw material was brought in and broken down, fed into the processing lines and assembled, and lastly, finished product was placed into the packaging, which then went into cases and onto wooden pallets. There was no separation of high-risk areas from low risk.

So, what did we do? We set up a temporary location for production (which was a major project in and of itself), redesigned the process flow, shut down the plant, and remodeled our production area.

Highlights of the redesign included:

      • Building a cleanroom for the production area. We walled off the raw material handling area by the receiving warehouse, enclosed the packaging area by the shipping warehouse, and made the room that housed the processing lines a cleanroom/high-risk room. Entry into the room required appropriate garb (clean smocks, hair restraints, gloves, captive shoes), use of the hands-free hand wash and sanitizer, and a pass through the boot sanitizer. The temperature of the room was reduced from 50oF to 38oF to discourage pathogen growth.
      • Setting up a raw material handling room. A separate “dirty” area was built to break down raw material components and remove them from their packaging (corrugate cases, plastic wrap). Raw material was then fed through a wall opening where a UV light was mounted to “sanitize” the outside of the material. This helped to reduce the introduction of cardboard packaging and wood pallets into the cleanroom and drive down any pathogens that might be on the surface of the raw material.
      • Adding a packaging room. All sealed, packaged finished product passed through a wall opening into the packaging room where it was boxed up and placed on pallets. This also helped to reduce the introduction of cardboard and wood into the clean room.

The new process flow allowed for employees to move from the “clean” processing room to the raw material or packaging rooms without any extra precautions, but they were required to go back through the clean room procedures prior to going back to the processing area. Raw material and packaging employees were excluded from the cleanroom to minimize potential of contamination from personnel flow.

We also reevaluated our Hazard Analysis and Critical Control Points (HACCP), Sanitation Standard Operating Procedures (SSOPs), and Sanitation and Environmental Monitoring (EM) programs to ensure all potential risk was identified and addressed either through the new facility design or other control measures. One key takeaway was to use the EM program to identify gaps and areas of opportunity rather than to just try to prove that everything is fine. We learned that having a comprehensive EM program that can capture all the necessary data points, analyze trends and drive corrective action helped our team use the program to drive food safety and continuous improvement. It wasn’t good enough to just have an EM program in place; we needed to use the data to address gaps and mitigate identified risks.

Conclusion

Foodborne pathogens are one of the biggest risks to the safety of our foods. Listeria poses a threat to a number of food categories (dairy, protein, and produce) and should be highlighted as a significant hazard to be assessed when developing and implementing your food safety programs. Using risk-based preventive controls within your facility will help prevent adverse events related to Listeria.

Food Transparency No Longer an Option

By Maria Fontanazza
No Comments

As consumers demand to know the “who, what, when, where and how” of products they purchase, companies must focus on bringing honesty to the table to build trust.

Consumers are becoming more informed about the dangers of certain ingredients and the presence of allergens and pesticides in food. In the future, virtually the only way companies can build and retain consumer trust is through providing transparency in the food chain.

“Transparency will no longer be an option,” says John Keogh, president and principal advisor at Shantalla Inc. “Food businesses have to commit themselves to transparency as the only way to demonstrate to the market how customer-oriented they are.” Keogh discussed the need for companies to be forthright not just about what is in food, but also the entire product journey—the who, what, when, where and how—during a recent webinar by the GMA Science and Education Foundation, “Transparency in the Food Value Chain”.

Drawing on examples such as the horsemeat scandal in Europe, trust is quickly lost when dishonesty rears its head. “We need to bring a level of honesty and ethics into supply chain transparency,” says Keogh. This includes disclosing where the product is made or grown, including the state, in the case of the United States; the province, in the case of Canada; and where Japan is concerned, the prefecture. A recent example is Taiwan’s plans to require prefecture labels of Japanese food imports following the Fukushima Daiichi nuclear power plant disaster, which has raised significant concerns over radioactive contamination in food.

As the supply chain becomes increasingly global and more complex, several factors are compelling transparency. Regulations that address food safety, security, defense, and fraud will all have an impact. The Foreign Supplier Verification Program (FSVP) under FSMA will put pressure on the nearly 200 countries that import products into the United States. According to Keogh, there are 220,000 importers on record, and they have about 300,000 facilities, all of which must be inspected under the FSVP mandate. In Europe, the EU regulation 1169/2011 requires the disclosure of more information to consumers, including mandatory origin labeling of unprocessed meat from pigs, sheep, goats and poultry, mandatory nutrition labels on process foods, and disclosure of allergens in the ingredient list. Companies will also need to consider requirements for Halal and Kosher foods.

Technology plays the key role in driving consumer awareness and demand for more information, but Keogh notes there is a gap between consumer expectations from a data perspective and the ability of companies to actually deliver this data. He offers some examples of emerging technologies that companies can use to facilitate supply chain transparency. Sourcemap is a supply chain mapping solution that allows companies to link from their raw materials sites to the end customers. Companies can generate reports from various metrics and identify the weak links in their supply chain. Trace One is a product lifecycle management solution that has a focused module for transparency. The company also recently announced the first B2B social network for supply chain transparency as well as the full alignment with GS1 standards and embedding fTrace into its platform. Manufacturers using Trace One have visibility on all of their ingredients, suppliers and facilities, and can search for products that may be affected by an ingredient or facility problems related to a recall, for example.

“Food chain transparency has the potential to create new business opportunities for retailers and manufacturers,” says Keogh. Moving forward, companies will need to have a foundation of standards, specifically GS1 Standards, and use them at a deeper level to enable interoperability between the technologies that supply chain partners use. Keogh urges companies to think beyond food safety and food quality to value-based transparency to increase value not just for the end consumer but also for supply chain partners. This will also involve ensuring privacy of data surrounding pricing and proprietary information.

Using ATP-based Methods for Cleaning and Sanitation Verification

By Camila Gadotti, M.S., Michael Hughes
1 Comment

There are several factors that must be considered when selecting a reliable and accurate system for detecting adenosine triphosphate.

A common way to assess the effectiveness of cleaning and sanitation programs in food manufacturing facilities is through the use of methods that detect adenosine triphosphate (ATP). Methods based on ATP detection are inexpensive and rapid, and provide the ability to perform onsite in real-time. There are several manufacturers of ATP-based methods, but choosing the most reliable one can be a daunting task. This article will discuss how these methods work and which factors should be considered to make an informed purchasing decision.

ATP is the universal energy currency in all living cells. It is present in all viable microorganisms (with the exception of viruses) and in foodstuffs. High amounts of ATP can be found in some fresh foods like vegetables, while other foods, especially highly processed foods such as fats, oils or sugar, contain very low amounts of this molecule. It is also important to know that ATP can be found in the environment in its free form hours after a cell has died.1 An ATP bioluminescence assay operates on the principle that ATP in food/food residues and microorganisms, in the presence of a luciferin/luciferase complex, leads to light emission. This light can be measured quantitatively by a luminometer (light-detecting instrument), with results available in 10–40 seconds. The amount of light emitted is proportional to the amount of ATP on a surface and hence its cleanliness. The light emitted is typically measured in relative light units (RLUs), calibrated for each make of instrument and set of reagents. Therefore, the readings obtained from assessing the cleaning of food manufacturing facilities need to be compared with baseline data representing acceptable clean values.

Varying Optical Components

Luminometers have evolved over the years from very large and cumbersome in size to small handheld models that can be used anywhere within a manufacturing facility. Although several components are housed inside these instruments, the optical component is the most important part of a luminometer. Used to detect light coming from the ATP/luciferin/luciferase reaction, the optical component is the defining factor related to luminometer reliability, sensitivity and repeatability. Good luminometers use a photomultiplier tube (PMT) in the light detection system; however, as part of the drive toward cheaper and smaller instruments, some manufacturers have replaced PMTs with less-sensitive photodiode-based systems. When using photodiodes, the swab chemistry must be adapted to produce more intense light. This results in a shorter duration of light, decreasing the time window allotted to place the swab in the luminometer and obtain an accurate read. A PMT, however, multiplies the electrical current produced when light strikes it by millions of times, allowing this optical device to detect a single photon. This approach emits light over a longer period of time. Although the weight of the system is also dependent on factors such as the battery, case and the display screen, a luminometer constructed with a photodiode will generally weigh less than a luminometer constructed with a PMT, since the former is smaller than the latter.

Sensitivity Testing

When an ATP hygiene monitoring system has poor sensitivity or repeatability, there is substantial risk that the test result does not truly represent the hygienic status of the location tested. Therefore, it may provide false positives leading to unnecessary chemical and labor costs and production delays, or false negatives leading to the use of contaminated pieces of equipment. A system that is sensitive to low-level contamination of a surface by microorganisms and/or food residues allows sanitarians to more accurately understand the status of a test point. The ability of a system to repeat results gives one peace of mind that the result is reliable and the actions taken are appropriate. To test different ATP systems for sensitivity, one can run the following simple test using at least eight swabs per system:

•    Make at least four serial dilutions of a microbial culture and a food product in a sterile phosphate buffer solution.
•    Using an accurate pipette, dispense 20 μl of these dilutions carefully onto the tip of the swabs of each ATP system and read the swabs in the respective luminometer, following the manufacturer’s instructions.
•    Use caution when dispensing the inoculum onto the swab head to prevent any sample loss or spillage. In addition, it is very important the swabs are inoculated immediately prior to reading, which means that each swab should be inoculated one at a time and read in the respective luminometer. Repeat this process for all the swabs.


To test different ATP systems for sensitivity, one can run a simple test using at least eight swabs per system. Photo courtesy of 3M

The most sensitive system will be the one that results in the most “fail results” (using the manufacturers’ recommended pass/caution/fail limits).

One can also test different ATP systems for repeatability by the following test:

•    Prepare a dilution of a standard ATP positive control or a food product such as fluid milk in a sterile phosphate buffer. If using a standard ATP positive control, follow the manufacturer’s direction to prepare dilution. If using fluid milk, add 1 ml of milk into 99 ml of phosphate buffer.
•    Using an accurate pipette, dispense 20 μl of this standard onto the tip of the swabs of each ATP system and read these swabs in their respective luminometer, following the manufacturer’s instructions.
•    Prepare and read at least 10 swabs for each system you are evaluating, and capture the results on a digital spreadsheet.
•    Once all 10 swab results (for each system) are in the spreadsheet, calculate the mean (=average) and standard deviation (=stdev) for each system’s data set. Divide the standard deviation by the mean and transform the result in percentage; this value is called the coefficient of variation percentage (CV%).
The test with the lowest CV% is the most repeatable and will provide the most reliable information to help make the correct decisions for a food manufacturing facility.

Choosing the Right ATP System

There are many ATP systems available on the market to support cleaning and sanitation verification in manufacturing plants. Some systems are more reliable than others and will provide results that are meaningful, accurate and repeatable. Be sure, therefore, not to choose a system solely based on its price. Check for the quality of the instrument, ask the sales representative what kind of optical device is used in the construction of the instrument and, moreover, perform an evaluation running tests for both sensitivity and repeatability. It is also important to consider the functionality and usability of the software provided with the system to ensure that the software can be used to customize sample plans, store test results and produce reports and graphs.

Reference

  1. Jay, J. M., ‎Loessner, M. J., & Golden, D. A. (2008). Modern Food Microbiology.


About the Author:

Camila Gadotti, M.S., is a field technical service professional and Michael Hughes is a technical service professional with 3M Food Safety.

How to Use FMEA to Risk Assess Pathogen Testing Methods

By Maria Fontanazza
No Comments

All methods are not equal, and companies must understand the testing methods used on a Certificate of Analysis.

A Certificate of Analysis (COA) can provide a company with a level of confidence in the quality and purity of its product.  However, the company should be able to take the document and understand how the results were gathered, says Maureen Harte, President and CEO at HartePro Consulting, and Lean Six Sigma Master Black Belt. Using Failure Modes and Effects Analysis (FMEA) can help a company identify, quantify and assess risks associated with pathogen detection methods, and should be integrated into a HACCP strategy.

Food Safety Tech: What are the challenges a company faces when assessing results on a Certificate of Analysis (COA)?

Maureen Harte: [Companies] lack the background information to really understand what goes into a COA, and they trust that what is coming to them is the highest quality.

FST: What questions should a company ask?

Harte: They need to consider everything that goes into the testing method itself.

•    What is the origin of the COA?
•    Who’s doing the testing?
•    What’s the complexity of the method?
•    What is the overall quality of the method?
•    How traceable is it?
•    How well can I trust that this result is the true result (are there false negatives)?

FST: How is FMEA used to evaluate pathogen testing methods?

Harte: FMEA helps us understand the differences between testing methods by individually identifying the risks associated with each method on its own. For each process step [in a test method], we ask: Where could it go wrong, and where could an error or failure mode occur? Then we put it down on paper and understand each failure mode.

For example, most methods have an incubation step. A simple failure mode would be that the incubator isn’t at the correct temperature, or that it has been incubated too long or not long enough. You go across the board for each step, identifying potential failures and the severity. Is there potential that we wouldn’t identify the pathogen? If so, what would happen to the customer? You also rate how often it might happen with the test method. What’s the frequency of it? The last thing we rate is detection. With or without controls, how easy would it be for the personnel in the lab to identify or detect that this problem occurred?

We rate these three factors: severity, frequency and detection, and whether we detect [the pathogen] before it goes out to the retailer or consumer. Then we multiply the ratings and come up with a risk priority number (RPN).  We add all RPNs for each step and figure out risk, and the potential for error, for each test methodology.

 Image courtesy of Roka Bioscience

FST: How does using FMEA integrate into a HACCP strategy?

Harte: It could be integrated into the HACCP strategy. HACCP deals with identifying potential safety risks, and the key to identifying the risks and proactively trying to eliminating them. That’s what the FMEA is doing as well. I think the integration of FMEA could help identify the critical control points and where the failures will occur. That would be the most streamlined approach.

Harte’s Tips

•    Don’t fully trust the COA unless you understand what the result means.
•    Get involved with the labs that are providing the testing to ensure you have the most comprehensive information surrounding the COA.

Harte is presenting “Behind the Certificate of Analysis: Risk Assessment in Pathogen Testing Methods” at the Food Safety Summit on Thursday, April 30, 12:30-1:00 pm.


Related stories

FSQA Enabling Technologies as a Food Safety and Quality Assurance Game Changer

Retail Food Safety Forum

Untangling the Net of Seafood Fraud

By Maria Fontanazza
No Comments

Achieving complete traceability is a must to combating seafood fraud. How is industry getting there?

The length and complexity of the seafood supply chain has created an ideal environment for fueling the mislabeling of the world’s most highly traded food commodity. Considering 91% of all seafood consumed in the United States imported, the ethical and economic impact of seafood mislabeling is enormous. While increased demand is putting pressure on the seafood industry, federal agencies are laying the groundwork to aggressively attack the rampant mislabeling problem.

“Illegal unregulated and unreported fishing is a huge global phenomenon that distorts markets and skews estimates of fish abundance,” said Kimberly Warner, PhD, senior scientist at Oceana, during a recent webinar on food fraud. The goal is to achieve complete transparency and traceability, keeping the “who, what, when, where, and how” with the fish. “Right now when fish are landed, they are required in the United States to list the species, where it was caught, [and] how it was caught. But that information is not following seafood through the supply chain.”

Simply put, seafood fraud is as any illegal activity that misrepresents the seafood one buys. According to Oceana, this can include not disclosing the real name of the fish or its origin, not providing an accurate weight, adding water or breadcrumbs, not declaring the presence of additives, or selling “fresh” fish that was previously frozen.

There are several motivations behind seafood fraud, says Warner. Some businesses want to increase profits and avoid profits; others want to hide illegally caught seafood or engage in trading endangered or threatened species, or mask seafood hazards; and some companies are just ignorant to the requirements of seafood labeling.

The lack of reliable and trustworthy information poses a challenge to consumers who want to make informed decisions when purchasing seafood. While proactive consumers use guides such as  “Seafood Watch”, a program offered by the by Monterey Bay Aquarium, in many cases they still do not have enough information to make a decision with complete confidence.

Supply Chain Traceability

Last month the Presidential Task Force on Combating Illegal, Unreported, and Unregulated Fishing and Seafood Fraud released its final recommendations for creating a risk-based traceability program that tracks seafood from harvest to entry into U.S. commerce. The ambitious action plan seeks to tackle the following goals:

•    Combat IUU fishing and seafood fraud at the international level
•    Strengthen enforcement and enhance enforcement tools
•    Create and expand partnerships with nonfederal entities to identify and eliminate seafood fraud and the sale of IUU seafood products in U.S. commerce
•    Increase information available on seafood products through additional traceability requirements

Key dates on the plan’s timeline include identifying the minimum types of information and operational standards by June 30, which will be followed by a 30-day comment period; engaging the public on principles used to define “at risk” species by July and releasing final principles and “at risk” species by October 2015; and building international capacity to manage fisheries and eliminate IUU fishing, with an interagency working group developing an action plan by April 2016.

Bait & Switch: Quick Stats Behind Seafood Mislabeling

•    Red snapper is the most commonly mislabeled fish (up to 28 species were found to be substituted, a large amount being tilapia)
•    74% of fish are mislabeled in sushi venues
•    38% of restaurants mislabel seafood
•    30% of shrimp samples misrepresented
•    Chesapeake Blue Crab cakes: out of 90 sampled, 38% mislabeled, with 44% coming from the Indo-Pacific region

Statistics generated from studies conducted by Oceana in which the organization gathered seafood samples nationwide. 


How can consumers protect themselves?

Warner’s advice: Ask the folks behind the seafood counter where they purchase their seafood from and whether it is farmed or fresh. If you can, buy the whole fish, because it’s harder to disguise when whole. And finally, if the price is too good to be true, it probably is. “Expect to pay more for wildly caught, responsibly fished seafood,” she said. 

Related content: InstantLabs Launches DNA-based Atlantic and Coho Salmon SpeciesID Test Kits to Combat Seafood Mislabeling

Does Your Company Really Understand GMO Labeling?

By Maria Fontanazza
No Comments

Consumers want to know what’s in their food, from artificial sweeteners and high-fructose corn syrup to dyes and pesticides. The latest hot-button issue surrounds foods made from genetically modified organisms (GMO) and the demand for companies to indicate on labeling whether a product contains GMOs.

In a recent Q&A with Food Safety Tech, James Cook, Food Scientific and Regulatory Affairs Manager at SGS, briefly discusses the challenges and misconceptions surrounding GMOs and labeling.

Food Safety Tech: What are the biggest challenges food companies face in communicating that their products are GMO-free?

James Cook: The biggest challenge for a company is to determine what words or phrases can be used concerning the regulations and/or laws of country that the product will be received into. Companies want to use GMO free, a terminology recognized by consumers, which is actually prohibited in certain locations such as the European Union (EU), and discouraged by the FDA.

FST: How has public (consumer) awareness of this issue complicated matters?

Cook: There is a diverse difference in dealing with the consumers in the EU that have a clear knowledge and unfortunately outrage to GMOs, and the consumers from the United States, where some have no idea what GMOs are.

FST: Are there misconceptions among consumers that present additional challenges to food companies?

Cook: The biggest misconceptions are: Everything created by humankind is evil, food crops have never changed, and the government and the industry are lying. Another misconception is that in the future, we will have enough food to feed the world population, without making significant changes in the way we produce food.   

FST: What are the most critical developments regarding state and federal labeling laws that we need to know about?

Cook: At this time, the Vermont law is the only breakthrough for the requirement [of] GMO labeling in the United States. If some non-government organization obtains passage of their bill through U.S Congress then this law will not come into effect. If this law becomes effective, we will have many states issuing and passing a similar law, as their consumers will want to know why this is required in Vermont but not in their states.

On April 16 Cook will be offering more insight on the topic during a GMO Labeling webinar. Register for the webinar now.

FST: Where do you see the GMO issue headed over the next year or so?

Cook: We will have some sort of GMO labeling law in the United States. Whether this law only affects one state or all of the U.S. is still unknown. Even if this is not solved, more locations in the United States will continue to ban the growing of GMO crops. Eventually these bans will make it into the courts, because you are dictating to a farmer what crops they can grow and sell.  

FST: What key questions will you address during the GMO Labeling webinar?

Cook: What does my company need to do in order to verify to a Non-GMO program?
Does one have to review the entire supply chain in order to prove the product is GMO free?
Why isn’t GMO product just labeled as such in the USA?
Why the vast difference of GMO policies between EU and USA?


Related Content: Expanding GMO Labeling Requirements in the U.S.


Food Safety Culture: Measure What You Treasure

By Lone Jespersen, Brian Bedard
1 Comment

A culture of food safety is built on a set of shared assumptions, behaviors and values that organizations and their employees embrace to produce and provide safe food. Employees must know the risks and hazards associated with their specific products, and know why managing these hazards and risks in a proactive and effective manner is important. In an organization with a strong food safety culture, individuals and peers behave in a way that represents these shared assumptions and value systems, and point out where leaders, peers, inspectors, visitors and others may fail to protect the safety of both the consumers and their organizations.

A number of factors influence these organizations, such as changing consumer demographics, emerging manufacturing hazards, and the regulatory environment. The United Nations predicts that the number of people over 60 years will double by 2035, the number of diabetes patients will increase by 35% (International Diabetes Federation), and the number of individuals living with dementia will increase by 69% (Alzheimer’s Disease International). This poses an increased urgency for food manufacturers, as these population cohorts are more susceptible to foodborne infections or may have challenges with food preparation instructions.

Much has been published on food safety culture, and we owe it to the front-runners to use their work to go deep into practical, everyday challenges and to continuously strengthen organizational and food safety culture.1 An element common to most of these publications is a reference to the importance of behaviors.2-8

There is a renewed recognition of the importance of individual behaviors specific to food safety and personal self-discipline in food processing and manufacturing organizations. Employees throughout the organization must be aware of their role and the expected food safety behaviors, and held accountable for practicing these behaviors. Embedding food safety culture in an organization can be very challenging given the need to carefully define appropriate behaviors, the difficulty in changing learned behaviors, and the complexity of objectively evaluating the level of food safety culture in a company. This article is an attempt to define useful food safety behaviors and to describe a behavior-based method that you can use to measure the maturity of your organization’s food safety culture.

Defining measurable behaviors

Behaviors is the element that, when combined with results, creates performance.9 Behaviors, if used to measure and strengthen food safety culture, must be defined carefully in a consistent, specific, and observable manner. Martin Fishbein and Icek Ajzen, authors of multiple publications on the Reasoned Action Approach, teach us how these three factors can be used to predict and explain human behavior, attitude, perceived norms and perceived control.10 They also teach us that behaviors can be defined consistently by including four elements (Figure 1).

Figure 1: Four components to a consistently defined behavior

Case: CCP operator on a baked chicken line. I work in a chicken processing company and am responsible for monitoring the internal cook temperature of chicken breasts after the product has gone through the oven. One of the important behaviors for my role could be defined as “Measure temperature of chicken after oven at predetermined time intervals”. This behavior is consistent, as it includes all four elements of the behavior definition (Table 1). The content of the behavior is defined in a way that makes it relevant for me, the CCP operator, and I am clear on the assumptions made by others on the processing line about my behavior. The behavior is observable and most people would be able to enter the processing area, observe the behavior and assess if it is performed as needed, YES or NO.

Leaving out any of the four elements of a behavior definition or becoming too general in your statements leads to poorly defined behaviors that are difficult to use as an assessment of behaviors, and ultimately as a measure of the sites for food safety culture (Table 1).

 Scenario  Behavior  Action Context Target Timing
Consistent, relevant, and observable  Measure and record temperature of three chicken pieces every hour at end of oven  Measure and record temperature  End of oven  Three chicken pieces  Every hour
Missing definition elements  Measure temperature at pre-determined intervals  Measure temperature  Not defined  Not defined  Pre-determined time intervals
Not specific  The product is cooked and checked every hour  Not defined  Not defined  The product  Every hour
Not observable  The product is cooked and check to see if it meets standard  Checked  Not defined  The product  Not defined
Table 1: Scenarios of defining behaviors

Behaviors are observable events and for this to be true, a behavior must be defined objectively in a language clear to everyone involved. It can be helpful to target a grade-six readability level, as it forces everybody writing the behavior to avoid words that are not understood in plain language.

Using behaviors to measure food safety culture

Assuming that behaviors are defined in a consistent, specific, and observable format, how do we decide the critical few behaviors that get measured? A suggested method is the use of the food safety maturity model (Table 2). The model outlines five capability areas that a processor or manufacturing company can use to measure its current state and to set priorities and direction. One capability area is Perceived Value that describes how an organization might see the value of food safety. The maturity level ranges from a low level of maturity of “Checking the box because regulators make us” to a high level of maturity for “food safety is an enabler for ongoing business growth and improvement”. Consistent, specific, and observable behaviors can be defined for each of these stages of maturity. By assessing the performance of these behaviors we can aggregate these assessment scores into a site or organization measure of the maturity of the site or organizational food safety culture. It is important to note that the maturity score does not measure “good or bad” culture. The measure is one of progression along the food safety maturity model scale, and can therefore be used to highlight areas of strength and help prioritize areas of improvement for the individual organization.


Table 2: Food Safety Maturity Model. The Food Safety Maturity Model was developed by Lone Jespersen in collaboration with Dr. John Butts, Raul Fajardo, Martha Gonzalez, Holly Mockus, Sara Mortimore, Dr. Payton Pruett, John Weisgerber, Dr. Mansel Griffiths, Dr. Tanya Maclaurin, Dr. Ben Chapman, Dr. Carol Wallace, and Deirdre Conway.

For more details on the food safety maturity model, visit www.cultivatefoodsafety.com.

Call to Action

The organization’s culture will influence how individuals throughout the group think about safety, their attitudes towards safety, their willingness to openly discuss safety concerns and share differing opinions with peers and supervisors, and, in general, the emphasis that they place on safety. However, to successfully create, strengthen, or sustain a food safety culture within an organization, the leaders must truly own it and promote it throughout the organization.8

The call-to-action for food industry leaders and regulators is to embrace a standardized measure of food safety culture to allow for comparison and sharing within an organization and between companies. “Food safety is everybody’s responsibility” was the theme of the recent GFSI Global Food Safety Conference in Kuala Lumpur, but to act on this with food safety culture as the ultimate outcome, we must adopt standardized measure. The GFSI benchmarking technical working group is an ideal forum to continue this dialogue.

During the upcoming GMA Science Forum April 12-15, 2015 join the conversation at a practical and detailed level. The preconference Food Safety Culture workshop takes place April 12, with facilitators from leading organizations;  the Food Safety Culture Signature Session on April 13 will discuss what our industry requires to enable this level of standardization and collaboration. For more information and to sign-up, visit http://www.gmaonline.org/forms/meeting/Microsite/scienceforum15.

References

  1. Schein, E. H. (2010). Organizational culture and leadership. San Francisco: Jossey-Bass.
  2. Ball, B., Wilcock, A., & Aung, M. (2009). Factors influencing workers to follow food safety management systems in meat plants in Ontario, Canada. International Journal of Environmental Health Research, 19(3), 201-218. doi:10.1080/09603120802527646.
  3. Hanacek, A. (2010). SCIENCE + CULTURE = SAFETY. National Provisioner, 224(4), 20-22,24,26,28-31.
  4. Hinsz, V. B., Nickell, G. S., & Park, E. S. (2007). The role of work habits in the motivation of food safety behaviors. Journal of Experimental Psychology: Applied, 13(2), 105-114. doi:10.1037/1076-898X.13.2.105.
  5. Nickell, G. S., & Hinsz, V. B. (2011). Having a conscientious personality helps an organizational climate of food safety predict food safety behavior. Food Supplies and Food Safety,189-198.
  6. Jespersen, L., & Huffman, R. (2014). Building food safety into the company culture: A look at maple leaf foods. Perspectives in Public Health, (May 8, 2014) doi:DOI: 10.1177/1757913914532620.
  7. Seward, S. (2012). Assessing the food safety culture of a manufacturing facility. Food Technology, 66(1), 44.
  8. Yiannas, F. (2009). In Frank Yiannas. (Ed.), Food safety culture creating a behavior-based food safety management system. New York: Springer, c2009.
  9. Braksick, L. W. (2007). Unlock behavior, unleash profits (Second ed.) McGraw-Hill.
  10. Fishbein, M., & Ajzen, I. (2009). Predicting and changing behavior: The reasoned action approach. London, GBR: Psychology Press.

Newer Regulations Clarify Food Microbiology Parameters for Labs

By Jacob Bowland
No Comments

Accuracy and validity of food test results hinge on purified water and annual water testing.

Laboratory-grade water literature is well documented among the large life science water manufacturers. General levels of resistivity, total organic carbon (TOC), particles and bacteria in water classify into Types 1, 2, or 3, with Type 1 having the most stringent requirements. Each type is useful for a different application depending on the procedure:1,2,3

  • Type 3. Generic applications where water will not come into contact with analytes during the procedure
  • Type 2. Standard applications such as media and buffers
  • Type 1. Critical applications such as GC, MS, HPLC analyzers4

Achieving high-quality water requires purification through a polishing step such as deionization (DI), reverse osmosis (RO), ultraviolet light (UV), filtration or distillation, which removes specific impurities.3,5

This classification system gets muddled, as different agencies have their own standard that examines different end-point analysis and levels:

  • ISO (International Organization for Standards)
  • CLSI (Clinical and Laboratory Standards Institute)
  • ASTM (American Society for Testing & Materials)
  • USP (United States Pharmacopoeia)2,5

With all these standards and testing in place, many labs assume that their installed DI water supply is clean, yet in reality, the water in general would be closer to Type 3 rather than the required Type 1. 

The problem with using lower quality water in food testing labs is that the accuracy and validity of tests will be compromised. Many of the analyzers requiring Type 1 water would recognize contamination from lower quality water, creating difficulty in identifying actual contamination or yielding false positives. False positives can result due to microorganism contamination in the water that is amplified through the testing procedure. In addition, dirty water can damage expensive machinery, because tools in the laboratory that are designed for a high-purity water supply can malfunction when less-pure water is used. For example, a system with microfilters can become rapidly clogged with lower quality water, introducing the possibility of flooding when tubing bursts, if left unnoticed.

Newer regulations in regards to ISO 11133:2014, along with ISO 17025:2005, provide clarity on food microbiology water parameters for the laboratory. ISO 11133:2014 “Microbiology of food, animal feed and water–Preparation, production, storage and performance testing of culture media” describes how water for culture media must be purified. The purification recommended is distilled, demineralized, DI, or RO, and stored in an inert container. To verify purity, labs must regularly test the water to assure microbial contamination is kept to a minimum. Regarding 17025:2005, which refers to food microbiology requirements for accreditation, there should be daily, weekly and monthly testing of the laboratory’s water source to verify required quality for microbiological water. Daily testing examines resistivity of water; monthly testing examines the water’s chlorine levels and aerobic plate counts; yearly testing examines heavy metals in the water. Therefore, accuracy and validity of food test results critically revolve around producing purified water and annual water testing.

Bibliography
1. Veolia. (n.d.). Water Quality. Retrieved from: http://www.elgalabwater.com/water-quality-en-us
2. Puretec Industrial Water. (n.d.). Laboratory Water Quality Standards. Retrieved from: http://puretecwater.com/laboratory-water-quality-standards.html
3. Millipore. (n.d.). Water in the Laboratory. Retrieved from: http://www.emdmillipore.com/US/en/water-purification/learning-centers/tutorial/OPab.qB.IxUAAAE_MkoRHe3J,nav
4. Denoncourt, J. (2010). Pure Water. Retrieved from: http://www.labmanager.com/lab-design-and-furnishings/2010/09/pure-water?fw1pk=2#.VRrT7fnF-Cn
 5. The National Institutes of Health. (2013). Laboratory Water, It’s Importance and Application. Retrieved from: http://orf.od.nih.gov/PoliciesAndGuidelines/Documents/DTR%20White%20Papers/Laboratory%20Water-Its%20Importance%20and%20Application-March-2013_508.pdf

Jacob Bowland is Product Manager at Heateflex and Steven Hausle is Vice President of Sales and Marketing at Heateflex.