RFID tags on drying marijuana flowers

Marijuana Edibles: Update on a Rapidly Developing Market

By Aaron G. Biros
No Comments
RFID tags on drying marijuana flowers

A lot has changed since last year’s article, “Marijuana Edibles: A Regulatory Nightmare.” Marijuana has since catapulted into mainstream thinking via activism, state decriminalization, and medical reforms while investors and banks are beginning to trust the market more, further legitimizing the nascent industry. According to an article from the Washington Post, Colorado’s legal marijuana industry reached $700 million in 2014 and is expected to grow to $1 billion by 2016.

Innovators are beginning to analyze trends on a national level, looking toward federal rescheduling of the drug as a catalyst for more state reforms and wider legalization measures. Federal legalization is in the back of many minds, as the introduction of pivotal state and federal legislative reforms promises more access to banking services, medical research, and more state independence.

While a black market mentality remains prevalent, widespread state reforms, increased venture capital investment, and further legitimization of an industry with less barriers of entry have fostered a perceived reduction in risk. States like Oregon, Washington, and Colorado that have already legalized marijuana for recreational and medical sales are beginning to implement strict packaging rules, requirements for traceability, QA programs, testing and laboratory monitoring requirements, and other regulations that would suggest FDA oversight down the road.

marijuana buds drying in racks biotrackthc
Dried marijuana buds curing with RFID tags as part of the traceability system of BiotrackTHC

State regulatory bodies such as the Colorado Marijuana Enforcement Division (MED) have matured and expanded their oversight to include certifications and requirements for lab testing and analysis. Marijuana testing facilities can now be certified by the MED to test for residual solvents, poisons or toxins, harmful chemicals, dangerous molds, mildew or filth, harmful microbials such as E. coli or Salmonella, pesticides, and THC levels and Cannabinoid potency.

According to an article from theCannabist.com, edible marijuana took 45% of the market share in 2014 and continues to grow, proving that food manufacturers and processors will gain a bigger share of the market.

BioTrackTHC develops a seed-to-sale traceability system that is the state-mandated reporting system used by any business that touches the plant in compliance with Washington’s i502 regulations (The company also won the contract bid for New Mexico’s and New York’s state-run traceability systems). “From day one, all retail products under i502, including infused edibles, must have laboratory-submitted passing test results and data in the traceability system before it can be unlocked for shipment to retailers,” says Patrick Vo, CEO of BioTrackTHC.

RFID tags on drying marijuana flowers
RFID tags on drying marijuana flowers, from BioTrackTHC

Regulations, especially those addressing traceability, are crucial for advancing the industry and fighting the black market, performing recalls, and improving product quality and safety. Vo adds, “As more states adopt a centralized traceability system, food safety will improve as we see the industry grow.”

“Most of the marijuana edibles producers we advise are working comfortably within their state health department regulations versus a year ago when they were struggling to implement routine compliance,” says Stephen Goldner, CEO of Regulatory Affairs Associates.  “But there is a long way to go to make this new marketplace meet the standards routinely met by US food producers in other markets such as nutritional supplements and medical foods.”

Many edible producers are sadly mistaken to ignore FDA labeling and production regulations just because the producer only ships within their own state, according to Goldner. “Whenever FDA has found label or food safety violations of products, whether they are food, drugs or any other product, it has always acted quickly to seize the product, inspect the producer and insist that violative labeling or production practices be remedied,” he says, adding that it won’t be surprising to see FDA start to “seize marijuana-infused food products that make drug claims, especially from the leading current producers” as a way for the agency to insert itself into the inspection and compliance process. “These companies need to have FDA food GMP’s solidly in place and properly documented,” says Goldner.

“Those who have experienced the most consistent and long term success in this industry are those who play above board, those who take the extra effort and make the investment in effort, time, and money to treat their business as if it was already federally legal and had to adhere to standards that other industries must follow,” says Vo. He agrees with the view held by many that long term planning is vital in this industry. “Those who have implemented best practices, QA programs, and traceability software will succeed in the long run, and the bad actors will eventually, by their own poor practices, be filtered out by regulatory and market forces.”

In the near future, the industry will look to other states in regulatory experiments on opposite sides of the spectrum. “New York, which legalized medical marijuana in 2014, is handing out 5 licenses to operate 4 dispensaries each, and allowing licensees to have a grow facility to supply their respective dispensaries. The Commissioner of the New York State Department of Health will have authority on licensing, testing, and medical requirements for patients seeking treatment with medical marijuana,” says R. David Marquez, who operates a Long Island law firm focusing on the cannabis industry.

New York is implementing very strict rules regarding cultivating and processing the plant. California, on the other side of the spectrum, already operates a somewhat loosely regulated medical marijuana market and has been doing so since 1996. The bill to legalize marijuana recreationally in the state is widely expected to pass vote and be implemented in 2016. This would open up an enormous market potential and contribute to the growth of the industry on a national level.

Because marijuana edibles are theoretically both a food and a drug, it is only appropriate that the FDA should look to regulate the industry in the future. In the meantime “Those who have invested the time and money in staying compliant now will be far ahead of the game tomorrow,” says Patrick Vo, who is looking toward federal legalization.

It seems that manufacturers and processors at the forefront of quality and safety testing will succeed in the long run.

Footnote: This is a regulatory update on the cannabis industry with an emphasis on edible marijuana. CannabisIndustryJournal.com, the newest publication, will be launched in September of this year. CannabisIndustryJournal.com will educate the marketplace covering news, technology, business trends, safety, quality, and the regulatory environment, aiding in the advancement of an informed and safe market for the global cannabis industry. Stay tuned for more!

Why Should Food Manufacturers Consider Lab Automation?

By Dr. Christine Paszko
No Comments

Food manufacturers that think strategically understand that labor efficiency is a measure of how effectively a workforce completes a task in comparison to industry. Companies frequently access efficiency and other metrics to identify weak points in their operations, with the end goal of enhancing data quality and streamlining costs. This approach has led many food and beverage manufacturers to embrace lean manufacturing and six sigma programs in their organizations. These leaders have a clear understanding that labor is money (or money is stored labor), and money equals margins. Food and beverage manufacturers often acquire several raw materials and convert them into finished products for consumers to purchase. These manufacturers have found that robotics and automation have greatly increased productivity and enhanced product quality while maximizing resources and profitability.

LIMS offer a variety of benefits. Image courtesy of ATL

Ease Operations with Automation

Analytical testing laboratories within food manufacturing firms leverage LIMS to realize automation savings. LIMS is an acronym for Laboratory Information Management System, which can also be a manual paper/Excel based solution, however, this article will focus on completely automated, computerized, enterprise, software solutions. Manual systems are cumbersome, costly, and lack efficiency.

Just as automation and robotics have transformed the food manufacturing process, intelligent laboratory operations leverage LIMS, because it enables increased quality and faster turnaround, while providing significant cost savings. LIMS are computerized systems that organize, manage and communicate all of the laboratory test data and related information such as Standard Operating Procedures (SOPs) and Certificates of Analysis (COAs), final analysis reports, invoices, nutritional labels, formulations and information to support an organization’s operations and meet regulatory compliance goals.

Traditional LIMS facilitate overall laboratory organization, from sample management to test data to final reporting and disposal. LIMS begin with sample management and typically the generation of barcoded labels (of a unique identification number), testing is automatically assigned based on project or sample type (Note: Additional tests can be added or deleted, and ad hoc samples can also be logged). Some laboratories test all raw materials that arrive to confirm acceptance criteria against the COA, in addition to in-process, final product testing and environmental testing. Once samples are logged into the system, worklists are created in the LIMS of the samples to be run and the information is scanned via barcode and sent to the instrument controller. Tests that include associated quality control data are run by loading instruments. Results are electronically imported back into the LIMS from instrumentation (this is the most common and most efficient method). For manual, subjective tests that require interpretation, results must be entered into the LIMS by hand. Managers can also manage and track samples that have been subcontracted to other laboratories (i.e., for testing capabilities that do not exist internally). Once the subcontracted data is submitted back to the laboratory in an electronic format, it can be directly imported into the LIMS, and all data related to the sample is stored in a single, secure database.

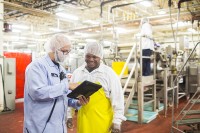
Automation significantly reduces cost, enhances quality and provides a means to rapidly scale production. This image shows a cheese processing plant. Image courtesy of ATL

This approach offers a major advantage, especially to global operations, due to the ability to deliver real-time data across an enterprise. End-users can leverage the technology to make intelligent buying decisions based on product specifications of incoming raw materials, customer demand, specification criteria and blending simulations.

Managers can view a variety of metrics, including the number of samples that have been run for a particular product, statistical process control charts, instruments in service for workload management, and supplier performance in any given period. Complete product traceability is possible.

LIMS has evolved to manage many additional functions, such as communications with ERP/SAP systems, shelf life studies, performing skip lot testing, formulations, and field and plant data collection by integration with tablets and smartphones for real-time updates, managing competitive analysis data as well as special projects. A few of the major areas in which LIMS are leveraged include:

  1. Sample management of all testing initiated
  2. Quality assurance (including in process quality checks)
  3. Workflow management (optimization of processes)
  4. Regulatory compliance (FSMA, GFSI, HACCP, FDA)
  5. Specification management, formulations and blending
  6. Dashboards for real-time updates (in a single site or across operations)
  7. Customer relationship management (organizing and responding to customer inquiries)
  8. Reporting (COA, final analysis and invoice reports)
  9. Inventory management and product release

Enabling Standardization

A LIMS not only enhances communication across a laboratory, but also across a global organization with multiple sites, ensuring effective cooperation and relationships between suppliers, production and customers. A LIMS promotes standardization in global firms and gives management teams real-time data access from site to site, so that data is readily available for better management and resource allocation decisions. Standardization makes business and financial sense, as organizations can realize cost savings in buying testing equipment and supplies in larger quantities, exchanging staff to different sites (potentially reducing training costs), and managing a user-friendly, single secure database that supports localization (each site can implement LIMS in its native language). Standardization does not mean that systems must be ridged; each facility can leverage its own unique workflows and terminology while saving data to a standard database format.

A LIMS can manage an entire organization’s laboratory SOPs or work instructions, and documents associated with the following:

  • Laboratory testing
  • Assets
  • Inventory
  • Laboratory chemicals
  • Supplies
  • Formulations
  • Blending
  • Automated calculations
  • Customer interactions
  • Employee training records
  • Laboratory instrumentation
  • Purchase orders
  • Sample storage
  • Reporting
  • Invoicing
  • Facilitating governmental laboratory compliance requirements

Today, LIMS’ have expanded to manage all aspects of laboratory operations and have significant overlap with ERP, SAP systems and other enterprise solutions. The goal is to move away from multiple separate databases and distinct islands to one centralized data management solution. Amazingly, some laboratories do not make the investment in new LIMS technology and continue use in-house created database systems, manual paper systems and Excel spreadsheets (or a combination of these systems) to manage portions of the critical product testing data. These systems are often costly, labor intensive, subject to data loss, and difficult to manage and maintain.

A LIMS ensures that analytical resources have been best utilized to maximize productivity and efficiency to generate high-quality data to support operations, while facilitating regulatory compliance goals. Organizations that embrace quality often leverage technology such as LIMS, and typically hold ISO 17025 certification and embrace six sigma, lean manufacturing and other best practices.

Robotics has transformed food manufacturing to allow greater volumes of final product to be produced, with an emphasis on speed, standardization, consistent product quality and volume, with increased efficiency and cost savings. LIMS’ have transformed the manufacturing process and the laboratory analysis process from raw material testing to in-process /environmental testing and finished product testing. For example, on-line monitors can feed data into an LIMS (i.e. flow, temperature from freezers or incubators), and if there are any alarming data points, instant notification is provided to the team via email or a phone call. This rapid response saves time for a corrective action to be put into place. Within the laboratory, if a shelf life study is underway and the incubator fails, an alert can be sent after one out-of-range temperature measurement, allowing the problem to be corrected and the study saved, versus having to start over.

The analytical testing group in any food and beverage testing facility generates hundreds, thousands, even millions of data points a year. They gather data on raw materials (based on COAs), in-process manufacturing (quality checks, statistical process control and specification confirmation), environmental monitoring, and finished product testing as well as performing competitive analysis. These are some of the main areas that are impacted by sample collection and testing. LIMS and laboratory automation have transformed the way that data is collected, monitored and analyzed. Today’s LIMS’ are based on modern technology, providing a valuable tool to ensure that product is within specification, and collected and disseminated in real-time to improve efficiency, reduce costs, increase profitability.

Rapid and Robust Technologies Improve Sample Preparation for Analyzing Mycotoxins

By Olga I. Shimelis
No Comments

Mycotoxins are produced as secondary metabolites by various mold species during the growth and harvest of grains, fruits, nuts and condiments. Their production is directly related to the dry/wet weather conditions during the growing season. Mycotoxins are very stable compounds and are not easily removed during storage, processing and preparation of raw agricultural commodities.

Mycotoxins & Grains
Mycotoxins can be found in a variety of grains.

Different classes of mycotoxins are distinguished on the basis of the structural similarity and originating mold species. For example, more than a dozen different aflatoxin compounds exist but only five of them are routinely tested (aflatoxins B1, B2, G1, G2, and M1). Aflatoxin B1 is of particular interest because it is listed as a Group 1 Carcinogen by the International Agency for Research on Cancer (IARC). Aflatoxin M1 is a metabolic product that can be present in milk upon ingestion of aflatoxin B1 by an animal. Aflatoxins are ubiquitous in important agricultural commodities including maize and peanuts, and are among the most studied mycotoxins.

Deoxynivalenol (DON) is produced by a different fungi species. It is prevalent in cereal crops grown under wet conditions and temperatures above 15o C (60o F). Chronic exposure of livestock to DON may result in slowed growth, impaired immune function and reduced rates of reproduction, particularly in non-ruminants.

Mycotoxins were discovered as the cause of poisoning outbreaks in both humans and farm animals in the mid-20th century. Since then, multiple government regulations were established to control the presence of these toxic compounds in food and feeds. For example, harvested grains are checked for mycotoxin contamination using rapid field screening methods prior to grain deposition into silos. If contamination is found, the crops are sent to an analytical laboratory to perform the confirmation analysis. Liquid chromatographic methods were often used for such analysis with both fluorescence and UV detection. In recent years, mass spectrometry has been employed as a detection method.

Sample Preparation for Laboratory Mycotoxin Analysis

When performing analysis, it is important to choose the right sample preparation method to ensure accuracy, sensitivity of detection, repeatability and robustness, as well as fast sample preparation for high throughput. During laboratory analysis of mycotoxins, the sample preparation procedure typically includes extraction, purification and concentration steps.

Extraction of mycotoxins from samples is conducted by mixing the ground sample with the mixture of organic solvent and water, such as acetonitrile:water (80:20). Using methanol is not recommended, because it does not provide complete extraction. Prior to cleanup, the sample is filtered. Historically, mycotoxin analysis required extensive extract cleanup to minimize interference by matrix components. This holds true as new regulations continue to require lower detection limits.

Cleanup methodologies often include the use of phase extraction (SPE). Of the different types of SPE, one of the most common is the use of immunoaffinity sorbents that result in the selective retention and cleanup of mycotoxins. The drawback to using the immunoaffinity sorbents in the lab is that they are not compatible with the mycotoxin extraction solvent. In order to load the extract into the immunoaffinity SPE tube, the extract must be diluted with water, sometimes 20-fold, to prevent precipitation or folding of the protein-based antibodies by exposure to organic solvent. This presents an additional sample preparation challenge, as the grain extracts tend to form precipitates upon the addition of water and can clog the SPE columns. Thus, apart from the high cost of immunoaffinity SPE columns, the methods tend to be labor and timeintensive.

Super Tox SPE cartridges
Super Tox is a line of SPE cartridges for mycotoxin families that eliminates extra sample prep steps.

It would be beneficial to a laboratory to eliminate these extra sample preparation steps required by immunoaffinity SPE. Such cleanup SPE procedures are available and can be applied directly to the mycotoxin extracts without the need for further dilution, filtration and evaporation. A line of SPE cartridges for different mycotoxin families was recently introduced to the market. These SPE cartridges are compatible with the extracts generated during mycotoxin extractions and can be stored at room temperature. The tubes can also be used for cleanup of multiple classes of mycotoxins.

Analysis of Aflatoxins and Zearalenone

SPE cartridges are available for aflatoxins and zearalenone.

The following results employed SPE cartridges for mycotoxins that can be used for two aflatoxin classes, aflatoxins and zearalenone, and were applied to the cleanup of grain and peanut extracts. Results were compared to cleanup using immunoaffinity columns.

AflaZea SPE cartridges are based on the “interference removal” strategy that requires fewer processing steps compared to the “bind-and-elute” strategy of the other SPE. Peanut extracts contain not only co-extracted protein and complex carbohydrates but also fat. This extract was successfully cleaned using AflaZea SPE. When the SPE tube and a leading IAC column were applied to the peanut extract, both methods demonstrated good recoveries for spiked aflatoxins B1, B2, G1, G2 with AflaZea recovery values of 101–108% and immunoaffinity recovery values of 79–100%. However, the AflaZea provided better reproducibility for detection with a relative standard deviation (RSD) of 2–4% RSD versus 10–25% RSD with immunoaffinity SPE. This is likely because sample preparation using AflaZea is less tedious and takes one tenth of the time compared to immunoaffinity SPE.

Analysis of Deoxynivalenol

Wheat samples can be analyzed for deoxynivalenol using a new SPE cartridge.

The following compares a new SPE cartridge for the analysis of DON, one of the Fusarium mycotoxins, with immunoaffinity SPE. Analysis of DON often is conducted using liquid chromatography (LC) with UV detection, so sample cleanliness is important to permit the separation of the DON peak from background interferences. The new SPE DON cartridge was compared to the immunoaffinity SPE for the cleanup and analysis of wheat samples. Clean chromatography and good recovery of spiked DON was obtained by both methods (86–97% RSD). However, clogging of the filters by the immunoaffinity SPE sample was observed during cleanup and complicated the sample preparation procedure. The SPE DON cartridge provided faster sample preparation.

Analysis of Patulin

Patulin is a mycotoxin commonly found in rotting apples.

Another SPE technology for mycotoxin analysis is based on molecularly imprinted polymers (MIPs), which are sometimes called “chemical antibodies” and mimic the performance of immunoaffinity sorbents. MIPs have binding sites that conform to the shape and functionality of specific compounds or compound classes. Strong binding of the analyte to the MIP makes it possible to perform intensive SPE washes that lead to very clean samples. Unlike immunoaffinity sorbents, MIPs are compatible with organic solvents and strong acids and bases.

Foods containing apples and similar fruits are required to be tested for patulin toxin, as they are the most common source for patulin exposure in humans. The MIP SPE procedure for patulin is faster than other SPE or liquid-liquid extraction methods and provides selective retention and superior cleanup. It is a robust method for analyzing apple juice and apple puree with HPLC-UV detection. After cleanup, patulin is quantified in apple puree at 10 ppb levels, which meet most regulatory requirements. The MIP SPE cleanup method eliminated 5-(hydroxymethyl)furfural (HMF) from the matrix, which sometimes appears as an interfering chromatographic peak when other sample prep methods are used. An SPE wash using sodium bicarbonate removed the interfering organic acids, while patulin was stabilized during elution at the end of the SPE procedure by using acidified solvent. Thus, most problems encountered during patulin analysis were resolved during this single SPE procedure.

Conclusion

As government regulations and consumer demand warrant cleaner, non-contaminated products, mycotoxin analysis will continue to be performed around the world. Careful selection of sample preparation methods is required for such analysis to achieve accurate testing results, best method performance and high laboratory throughput. Although many sample preparation methods exist, laboratories should choose the methods that not only provide adequately prepared samples, but also result in time and cost savings. The SPE technologies discussed in this article are sample preparation techniques that provide the required analytical sensitivity without capital expenditure into higher-end LC-MS equipment; the LC-UV and LC-FL methods can still be used. In addition, these SPE methods are simple, more robust, and less-time consuming compared to other SPE methods or liquid-liquid extraction.

All images courtesy of Sigma Aldrich

Participating in VQIP a Gold Star in FDA’s Eyes

By Maria Fontanazza
No Comments

Acceptance into the Voluntary Qualified Importer Program serves as proof that your company has a best-in-class food safety program.

As is evident in the name, the Voluntary Qualified Importer Program (VQIP), is just that—voluntary. However, participants in the program are showing that they are going above and beyond the requirements (i.e., FSMA’s Foreign Supplier Verification Program), which in the long run, is good for business and their marketing.

“VQIP is meant to be a step up—it’s almost a push for regulators to offer incentive programs for those suppliers and a way to reward good behavior,” said Melanie Neumann, executive vice president and chief financial officer of The Acheson Group. “VQIP is looking for a best-in-class supplier control program, and it’s meant to incentivize those companies who have it and can prove it.” During a recent FSMA Fridays session organized by SafetyChain, Neumann and David Acheson, MD, CEO and president of The Acheson Group, discussed the basics of VQIP and the benefits of participating in the program.

Under FSMA, FDA is required to develop a voluntary and fee-based program that enables expedited review of foods from importers that have achieved specific criteria related to supply chain safety and security.  The agency released the draft guidance in June. The annual fee to participate in the program is estimated to cost $16,400, and FDA has also requested comment as to whether this fee will pose a burden on smaller businesses. Applications are filed online.

To qualify for participation in the program, companies must meet several requirements. Businesses must:

  • Have a record of importing foods into the United States for at least three years
  • Have a Data Universal Numbering System (DUNS) number
  • Use a paperless filer/broker that has received a pass rating from its FDA filer evaluation
  • Have a quality assurance program and submit documentation of assurance program
  • Be compliant with FSVP

Businesses must not:

  • Have any imported food that is subject to either an import alert or Class I recall
  • Have any ongoing FDA administrative or judicial history of significant noncompliance
  • Be subject to any safety or security customs and border protection penalties and sanctions

One of the most important elements of the eligibility requirements is proof of a quality assurance program, according to Acheson. He highlighted several components that companies must have as part of their quality assurance program, including:

  • Corporate policy quality statements, relating to food safety and security explaining how a company is controlling risk in its supply chain
  • An organization chart (or a written explanation of management structure)
  • Policies and procedures that will be implemented to ensure a company’s system is producing safe food
  • Written description of the food defense system
  • Documentation of a company’s experience in employee training for those responsible for implementing the quality assurance program
  • Procedures for assuring the program is current and appropriately implemented
  • Written procedures for maintaining records relating to structures and process and procedures of the program
  • References to sources used to develop the quality assurance program

“The message here is that FDA is saying we really want to make sure you have a robust system,” said Acheson. He added that although businesses must apply each year, once the initial heavily lifting is done the first year (and assuming the company has maintained the required standards), reapplication should not be as onerous.

Once a company has been accepted into the program, it can expect expedited entry of imported foods into the United States and limited examination or sampling of VQUO foods (unless there is a “for cause” situation).
 
“If you have qualified for this program, you’ve really got the FDA gold star,” said Acheson. “That’s a marketable item. If you can say your product is VQIP approved, it’s a leverageable opportunity for the importer for their customers.”

Food Defense Culture is Coming

By Maria Fontanazza
1 Comment

FSMA’s proposed rule on intentional adulteration isn’t the only reason companies should be paying attention to food defense.

Establishing metrics in food defense, similar to the growing awareness around the importance of measuring behaviors in a food safety culture, was a topic recently brought up at FDA’s FSMA public meeting in the spring. The agency acknowledged that it will need to both clearly define what exactly is intentional adulteration and how it can be measured.

While food safety involves assessing and mitigating hazards, food defense is all about the threat and protection against intentional contamination. “The threat of fraud is a growing problem as supply chains get more complex, resources grow scarcer and the cost of food increases. All this provides more opportunity and potential reward for food adulterers,” stated a recent PwC report on food trust.

The FSMA final rule Focused Mitigation Strategies to Protect Food Against Intentional Adulteration is scheduled to be published in spring 2016, and companies need to be revisiting and revamping their food defense plans to prepare.

Prevention is the key word and on the most fundamental level of a food defense plan, businesses need to have management commitment before building, or even revisiting, a food defense plan—do they understand the resources, time and cost involved?

Conducting a vulnerability assessment is the first step in finding the gaps and examining whether a facility is secure. Beyond the standard questions that companies may ask when embarking on this assessment, businesses should identify potential attackers, asking how an attacker could have access to a product or process and what would be the outcome of an attack. Then look at the protective measures that are already in place—would these act as a deterrent? And if deterred, would the attacker proceed to the next target or would he or she stop? What measures are in place to find the attacker before there is an effect on the product?

When developing a food defense plan, there are several areas of potential vulnerability:

  • Shipping and receiving and packaging
  • Laboratories and testing sites
  • Recall and traceability programs and processes
  • Water used in processing/manufacturing—what is its origin?
  • Employees—what are the health risks? Is there a process for employee health reporting? Is there a process for reporting disgruntled employees?
  • Security personnel

With food fraud on the rise, it’s important for companies to continue to revisit and update their food defense plans, considering changes to facility designs or strategies, packaging changes, security improvements, etc. Companies should also be proactive in monitoring their employees both from a satisfaction (reducing the incidence of a disgruntled employee) and awareness perspective. FDA has initiatives to help companies build a food defense culture and employee awareness, including the ALERT training course for owners and operators of food facilities and Employees FIRST, and the National Center for Food Protection and Defense has programs aimed at workforce training as well as undergraduate and graduate curriculum on food defense.

The Raw Facts on Raw Milk Safety

By Wilfredo Dominguez Nunez, Ph.D.
No Comments

Based on prevalent blog posts and advocacy organizations claiming benefits for raw milk consumption (ranging from alleviating lactose intolerance to treating cancer) and the fact that milk in general has become a growing staple of the American diet, one would surmise that non-pasteurized or homogenized milk is the biggest thing to hit the kitchen since the sliced bread you might pair with it.

However, in reality, it is estimated that less than 1% of U.S. milk production is consumed raw. 1,6,8 Government agencies, in fact, advise against its consumption.2 Yet despite its supporters, raw milk continues to be a topic of heated debate on news channels and social media.

Outbreaks associated with raw milk consumption are disproportionally more common in a per-pound-consumed basis compared to outbreaks associated with pasteurized milk.6 During the period between 1993 and 2006, 121 outbreaks were traced back to dairy products. From those cases, raw dairy products were responsible for 73 outbreaks, 1,575 ill individuals, 202 hospitalizations, and two deaths. Comparatively, pasteurized products were responsible for 48 outbreaks, 2,842 ill individuals, 37 hospitalizations, and one death. In a per-pound-consumed basis, raw milk products were responsible for at least 100 times more outbreaks, ill persons, hospitalizations and deaths than the pasteurized products.

Advocates of raw milk, who believe that conventional processing used in pasteurized milk (heat treatment, homogenization, etc.) impedes the health benefits stated above, suggest that good practices alone can guarantee a safe supply of raw milk. Certainly, due to the lack of a heat treatment, raw milk safety relies exclusively on proper production, transportation and storage practices. These practices are now part of a well-established set of standard operating procedures that yield high-quality milk. In the United States, the Grade A Pasteurized Milk Ordinance (PMO), published by the Food and Drug Administration, defines minimum sanitary conditions for which milk is acceptable for fluid consumption, and most dairy farms today produce milk with total bacterial counts significantly below the 10,000 colony forming units per milliliter (CFU/ml) minimum standard.7,9 In fact, under excellent management and milking conditions the counts can reach levels below 1,000 CFU/ml.7

Based on these numbers, the United States probably has one of the safest and highest quality milk supplies in the world. However, even under these regulated farming, milking, storing and transporting conditions, human pathogens have often been detected from milking facilities around the country in several independent studies.7 L. monocytogenes has been found in up to 12.6% of milking facilities, and its infection can be fatal. Salmonella spp., which has shown 6.1% prevalence in milking facilities, can produce severe gastrointestinal distress and death. Pathogenic E. coli infection is able to produce permanent kidney damage and death. This pathogen has been found in up to 4% of surveyed dairy farms.

The fact is that milk, as a nutritious and close-to-neutral pH food, is a good medium for the growth of these and other pathogens, and some pathogens (i.e., L. monocytogenes) are capable of growing at the refrigerated temperatures in which milk is stored.5 An additional and extremely important factor is that it only takes a few cells—sometimes as low as 10, according to estimates—to cause an infection.5

Microbial Testing: Not all Tests and Samples are Alike

Some believe that successful microbial testing of raw milk render it as safe to consume. Although testing is a powerful tool for food safety, producers and consumers should know that it is highly dependent on the quality of the sample taken and the information that the particular microbial test can provide.

Coliform testing serves as a good example. Commonly used to assess the level of potential fecal contamination in a sample, this microbial test is performed by using a selective medium that inhibits the growth of many microorganisms and allows the growth of other organisms, namely those found in the intestinal tract of warm-blooded animals like cattle and humans, at a defined temperature.4 Therefore, although the levels of these organisms give an indication of the sanitary conditions in which the milk was produced, there are still many pathogens that will be overlooked by a coliform test, as they will not grow under the conditions described.

In addition, end-product testing for pathogens provides a limited amount of information since very low levels could be present, and the contamination might not be homogeneous. Testing is only valuable as part of an integral food safety strategy that has been validated to reduce the risk of pathogens under the conditions that the milk is produced. Otherwise, tests results have little to no value.

Petrifilm Plate Use on Milk Samples

In recent months, some advocacy organizations have claimed that raw milk is safe to consume after being successfully tested on Petrifilm Plates, a testing technology that has become a staple within the food industry, including dairy processing, for more than 30 years. It has long been recognized as an official method by the AOAC International Official Methods of Analysis.

Petrifilm Plate technology is available for several tests that can assess the quality and safety of milk as well as the environment in which it was produced. However, it is important to understand that any given test provides limited information regarding the type of organisms in the sample. Therefore, multiple indicator tests must be used to more fully characterize the microorganisms present. It is also critical to keep in mind that no test can substitute good production practices and that, statistically speaking, outbreaks associated with raw milk have been much greater than pasteurized milk.

Environmental testing is arguably more important than end-product testing, as the environment is often the source of contamination. A quality and safety program should include a strong environmental sampling component. Environmental samples can be collected using a sponge for large surfaces or swab for hard-to-reach areas. Collected samples can then be “plated” to the aerobic count plate (a 48-hour test) or rapid aerobic count plate (a 24-hour test) to conduct a standard plate count, also known as aerobic plate count, which gives a general indication of the microbial load in a product or environment. The test is conducted in non-selective medium that allows the growth of a wide range of bacteria that can then be visualized and enumerated (counted). Therefore, it provides an initial gauge of the sanitary conditions of the food product and the environment in which it is produced. The results can be reported as CFU per unit of volume (milliliter, ml), weight (gram, g) or surface (square centimeter, cm2) depending on the type of sample tested. In the United States, Grade A milk must have a microbial load less than 100,000 CFU/ml for raw and must be below 20,000 CFU/ml after pasteurization. In addition, the PMO also includes specifications for bacterial loads of single-service containers and closures.

Figure 1. Raw milk sample plated onto A) 3M Petrifilm Rapid Aerobic Count incubated for 24 hours and B) Standard Methods Agar incubated at 48 hours.

For raw milk, the time to results and the ease of reading makes the Petrifilm Rapid Aerobic Count Plate an ideal testing tool. Launched in early 2015, it harbors a dual-sensing indicator technology that yields blue/green and red colonies to facilitate enumeration. In addition, this plate was engineered with technology that resists distortion often caused by spreader colonies (see Figure 1).

Coliform Counts Too

Visualizing the microorganisms identified with the standard plate count is not enough. More testing is needed to suggest the presence of fecal contamination. The term “fecal coliforms” is used to describe a sub-group of coliforms such as E. coli and Klebsiella spp that are differentiated by their ability to ferment lactose at high temperatures.3 Enumeration of E. coli is arguably the best routine indicator of fecal contamination. E. coli is rarely found growing in environments outside the intestine, although they are able to survive, and their enumeration is relatively simple and rapid. While the PMO has no coliform standard for raw milk, it states that the coliform count in pasteurized milk should not exceed 10 CFU/ml.

The Importance of a Comprehensive Safety and Quality Strategy

As discussion of raw milk expands and is promoted by several groups, the safety of the product becomes a more generalized issue. Similar to other ready-to-eat products, safe raw milk consumption depends on integrated systems that assess, monitor, validate and verify the process and environment in which processing, storing and distributing occurs. Yet unlike other ready-to-eat products, or pasteurized milk for that matter, raw milk lacks any intervention to reduce the microbial load present. Therefore, monitoring of this microbial load in product and environment is an important aspect of quality and safety.

However, it is important to understand that any kind of microbial testing is only significant when it is part of an integral, comprehensive safety and quality strategy. Test results alone cannot replace good practices or interventions designed to reduce microbial loads to acceptable levels were the occurrence of foodborne pathogens is less likely.

References

  1. Centers for Disease Control and Prevention. (2007). Foodborne Active Surveillance Network (FoodNet) Population Survey Atlas of Exposures, 2006-2007. Atlanta: U.S. Department of Health and Human Services, Centers for Disease Control and Prevention.
  2. Center for Disease Control and Prevention. “Raw Milk Questions and Answers”. Accessed March 2015. Retrieved from: http://www.cdc.gov/foodsafety/rawmilk/raw-milk-questions-and-answers.html.
  3. Eijkman, C. (1904). Die garungsprobe bei 46° als hilfsmittel bei der trinkwasseruntersuchung. Zentr. Bakteriol. Parasitenk. Abt. I. Orig. 37:742.
  4. Feng, P., Weagant, S.D., Grant, M.A., Burkhardt, W. (1998). Bacteriological Analytical Manual, 8th Edition, Revision A. Chapter 4 BAM: Enumeration of Escherichia coli and the Coliform Bacteria. Accessed March 2015. Retrieved from: http://www.fda.gov/Food/FoodScienceResearch/LaboratoryMethods/ucm064948.htm.
  5. Food and Drug Administration. (2012). Bad Bug Book, Foodborne Pathogenic Microorganisms and Natural Toxins.
  6. Langer, A.J., Ayers, T., Grass, J., Lynch, M., Angulo, F.J., Mahon, B.E. (2012). Nonpasteurized dairy products, disease outbreaks, and state laws—United States, 1993–2006. Emerg Infect Dis. 18(3):385–391.
  7. Oliver, S.P., Boor, K.J., Murphy, S.C., Murinda, S.E. (2009). Food safety hazards associated with consumption of raw milk. Foodborne Pathog Dis. 6:793-806.
  8. U.S. Department of Agriculture. “Milk production”. Accessed March 2015. Retrieved from: www.nass.usda.gov.
  9. U.S. Department of Health and Human Services, Public Health Service, Food and Drug Administration. Grade ‘‘A’’ Pasteurized Milk Ordinance, 2009 Revision.

Why LIMS Is a Necessity, Not a Nicety

By Dr. Christine Paszko
No Comments

How a laboratory information management system can facilitate safety testing and regulatory compliance within a food processor’s lab.

The food industry is under pressure to produce high-quality products while adhering to stringent microbiological testing standards controlling costs and meeting regulatory compliance goals. Food companies face a number of regulations and requirements, including those related to Good Manufacturing Practices, nutritional labeling, HACCP (Hazard Analysis and Critical Control Points), public health security, the Bioterrorism Preparedness and Response Act of 2002, and FSMA. For laboratories that offer products globally, the Global Food Safety Initiative focuses on continuous improvement of food safety management systems to ensure confidence in the delivery of safe food to consumers. Many companies face these regulatory challenges armed with a stable and secure laboratory information management system (LIMS) and laboratory automation solutions. LIMS solutions can provide a cost-effective means to ensure that product standards are met, product is delivered as quickly as possible, and managers and staff have the tools to effectively do their jobs. While there are many commercially available LIMS solutions, it is critical that laboratory managers perform due diligence to ensure that the system they select will be successful in the lab. Some ways in which an LIMS vendor can differentiate itself includes: having ISO 9001 certification offering a qualified staff, being a certified Microsoft Gold Partner, and offering software solutions based on the latest technology that allows users to leverage the Internet, tablets and smartphones.

Implementing an LIMS: The problem and the solution

A microbiology laboratory of a meat processor was looking for ways to eliminate transcription errors, and shorten its analysis turnaround time and reporting time through automation. The company was experiencing increasing sample volume, which would require hiring additional resources that had to be trained and deployed. However, taking on more personnel was not an option. To manage its growing sample volume, the company was seeking an LIMS that could also interface with its laboratory instruments and manage plant samples from multiple remote sites. An evaluation of current processes revealed multiple opportunities to automate data entry, reporting, and eliminate dual and triple entry while accelerating and automating data handling and test scheduling.

Samples, including raw materials, finished products and plant samples, were sent from multiple plants to the laboratory daily for environmental monitoring. The current manual system was labor intensive and required that all processes be manually checked and re-checked for accuracy prior to data release. Data was entered into the manual systems multiple times. Instrument data was not integrated with the reporting and the lab was increasing its sample volume for the instruments alone by up to 900 samples per day. Primary reasons for investing in LIMS automation included:

•    Having the ability to do more work with the same resources (removing manual tasks)
•    Enhancing data management into a single, secure data base
•    Meeting regulatory compliance goals
•    Operating under enhanced efficiency and data quality
•    Facilitation of standards and increased communication across their operations
•    Cost savings

Automation reduces transcription errors, increases productivity, enhances data quality and accelerates result delivery. Faster turnaround translates into faster product release, longer shelf-life and ultimately, cost savings.

Then: Prior to implementing the LIMS, samples would arrive at the food processor’s laboratory each morning. From there, they were manually sorted, paperwork was organized, and checks were conducted to verify receipt of samples.

Now: LIMS has significantly streamlined the process. Each morning, a work list is printed from the LIMS, identifying which samples will be received from the plants. The samples are organized and prepared for analysis and placed on the instruments with barcoded work lists for rapid and accurate set up.

The microbiology laboratory leveraged an automated food pathogen detection system to test for Listeria spp., Salmonella spp. and E.coli:0157:H7 on various sample types. Prior to automation, the manual steps of loading the sample IDs, scanning the print outs from the instruments, and then entering the data into reports with secondary review required 40 to 45 minutes per batch of 60 samples.

 Two of the four instruments interfaced with a LIMS.

Implementation of the LIMS has reduced report review time to five minutes. The data is received by the LIMS, and the email is automatically parsed and ready to receive the samples. The emailed worksheets, which are also automatically imported into the LIMS, eliminate several manual steps, including the time in which the laboratory team spent cross-checking samples with the paperwork and calling for missing samples. In this case, the automation has reduced the amount of paperwork and significantly streamlined the process. Now the laboratory knows which samples it will be receiving each day and can quickly match the samples to previously imported work lists.

Once the samples are loaded on the pathogen detection instrument to match the work list from the LIMS, the screening is conducted and the data is sent back to the LIMS, with the final analysis report completed automatically.

 
 An example of a final report automatically generated from the system, which is also automatically emailed.


Conclusion

Primary enhancements to implementing an LIMS include higher data quality and significant time savings (a conservative estimate: LIMS typically saves customers between 25-45% of time on their operations). On the instrument integration alone, the automation saved 35 to 40 minutes of work per batch (a batch contains 60 samples), and a typical day includes 10 to12 batches, or up to 720 test results per day. Conservatively, if we allot 35 minutes per batch and 10 batches per day, the time savings are nearly six     hours daily, and this is only from interfacing four instruments. Additional time savings are also realized as a result of reducing data errors.

An alternative solution to hiring additional staff to work in the lab involved examining the benefits of automation to leverage existing resources and allowing them to be more productive. This path eliminated mundane tasks and allowed existing lab staff to focus on the LIMS  (managing, tracking and organizing data) and automation (barcoding, scanning, instrument integration, automated email imports and automated reporting). Laboratory staff was trained on-site and received follow-up training at the LIMS Boot Camp. As a result, workflows were streamlined, sample throughput was accelerated, and the lab experienced faster turnaround times.

Other benefits of deploying a new LIMS in the laboratory include increasing data security, having an audit trail if any approved and validated results required a change, full traceability, facilitating standardization across the organization, reducing the amount of paper forms, and automating the release and reporting process.


About the Author

Dr. Christine Paszko has extensive expertise in LIMS, laboratory automation and food safety testing. She is currently the VP of Sales and Marketing at Accelerated Technology Laboratories, Inc., (ATL). Prior to joining ATL, she worked at Applied Biosystems. She was responsible for the creation, marketing and sales of molecular test kits that leveraged the TaqMan technology to detect major foodborne pathogens such as Salmonella, Listeria, and E. coli 0157.

Listeria Invasion – How is it Creeping into Our Beloved Foods?

By Traci Slowinski
1 Comment

As a result of several recent high-profile Listeria-related recalls, interest in the foodborne pathogen is increasing and food processors must take preventive measures to keep it out of facilities.

Listeria monocytogenes is a gram-positive bacteria. It has 13 serotypes, three of which have been associated with the vast majority of foodborne infections (called listeriosis). Although it is not a leading cause of foodborne illness, it is among the leading causes of death from foodborne illness. This hardy pathogen is salt tolerant, thrives in cold, moist environments and can grow under refrigeration temperatures. Listeria is found throughout our environment including in soil, water, sewage, decaying vegetation and even some animals. Its presence has most often been identified in foods such as raw or under-pasteurized milk, smoked fish, deli meats, soft cheeses and raw vegetables.

For a healthy individual, Listeria may cause mild symptoms or have no effect at all. Fever, muscle aches, nausea, vomiting and diarrhea are common signs of infection. For the e  immunocompromised (the very young or old, pregnant women, or adults with weakened immune systems), symptoms can be more severe and include septicemia and meningitis; in pregnant women, it can cause miscarriage. Symptom-onset ranges from a few hours to two–three days, with durations lasting from days to several weeks, depending on the severity of infection.

Keep Listeria Out of Your Plant

The first line of defense against Listeria contamination is to keep it out of a facility, but that may not always be possible, thus a Listeria prevention plan should be integrated into a company’s food safety program, considering the following areas:

    • Employees—can be brought in on shoes and clothing, or through infected workers. Prevention includes:
      • Good Manufacturing Practices
        • Personnel Hygiene—proper hand washing, wearing clean clothes and shoes, wearing proper hair restraints
        • Employee Illness Policy—restriction/exclusion of ill employees
    • Raw Materials—introduction into the environment from raw ingredients (milk, fish, seafood, produce), pallets, cardboard, packaging material. Prevention includes:
      • Supply Chain Management
        • Supplier Approval Program—having strategic partners that ensure only safe, high-quality raw materials
        • Ingredient Management—requesting COAs, letters of guarantee, allergen control
        • Receiving/Storage Procedures—completing incoming inspections, proper nonconforming material handling
    • Processing Aids—harborage in ice, brine solutions, improperly filtered compressed air and HVAC units. Prevention includes:
      • Sanitation Program—proper cleaning/sanitizing of equipment
      • Preventative Maintenance—regular replacement/maintenance on filters/motors
      • Water, Air, and Steam—utilizing potable water, properly filtered air, properly treated steam
    • Equipment Design—contamination of conveyor belts, filling and packaging equipment, slicers/dicers, ice makers, hoses, equipment framework, condensate drip pans, maintenance tools, trash cans, tools for cleaning equipment (brushes and scouring pads). Prevention includes:
      • Sanitary Equipment Design – ensuring that all equipment can be broken down as far as possible and properly cleaned and sanitized to remove dirt, debris and micro-organisms
    • Process Flow—not maintaining segregation of high vs. low risk, clean vs. dirty. Prevention includes:
      • Separation of high-risk vs low-risk areas through time, space or physical barriers
      • Proper garb (smocks, hair restraints, captive shoe policy) and sanitary measures (hand wash and sanitize, shoe sanitizer) to reduce introduction into high-risk areas
      • Proper personnel flow or movement to prevent cross-contamination
    • Plant Environment—common pathogen harborage areas. Prevention includes:
      • Floors/Drains – splash back, biofilms
      • Overhead Structures – condensate, dust/debris
      • Waste Areas – trash buildup
      • Wash Areas – standing water
    • Sanitation Program—insufficient cleaning/sanitizing to remove pathogens. Prevention includes:
      • SSOP’s – comprehensive sanitation SOPs with special focus on hard-to-clean areas and equipment.
      • Drain Cleaning—proper frequency, chemicals and procedures
      • Clean-In-Place Systems—accessibility to hard-to-reach areas
      • Sanitizing Agents—quaternary ammonium compounds, peroxyacetic acid sanitizers (for biofilms)
    • Environmental Monitoring Program—tool to identify gaps and risk used improperly resulting in missed problems. Prevention includes:
      • Robust Sampling Plan—identify zones and sampling areas
      • Effective Track & Trend Tool—identify gaps or risk that require corrective/preventive action
      • Timely Corrective Action— ensure proper follow-up on any issues that arise

First Person: The Listeria Experience and Lessons Learned

The above list is by no means exhaustive when it comes to all the areas you need to consider when completing a gap analysis within your facility. Listeria can be very insidious, and you will need to be ever-vigilant to ensure it does not take hold in your environment. Believe me, I have been there when it has.

Once upon a time, I worked for a Ready-to-Eat processing plant. We had robust food safety and quality assurance programs. We employed two microbiologists and had a good environmental monitoring program. The sanitation team did a thorough job of cleaning and sanitizing every night, and we completed preoperational sanitation inspections (including ATP testing) every morning.

Then we had a Listeria recall.

It started out small. One sample tested by FDA came back positive. Then another…and another. More intensive environmental testing found Listeria in the plant—in the drains, in the hard to reach areas of the old slicers and MAP packaging equipment, and even in the production room cooling units.

After many, many hours of cleaning, sanitizing, testing and retesting, we determined that the current layout of the facility would never allow for complete elimination of the Listeria. We had one big production room where raw material was brought in and broken down, fed into the processing lines and assembled, and lastly, finished product was placed into the packaging, which then went into cases and onto wooden pallets. There was no separation of high-risk areas from low risk.

So, what did we do? We set up a temporary location for production (which was a major project in and of itself), redesigned the process flow, shut down the plant, and remodeled our production area.

Highlights of the redesign included:

      • Building a cleanroom for the production area. We walled off the raw material handling area by the receiving warehouse, enclosed the packaging area by the shipping warehouse, and made the room that housed the processing lines a cleanroom/high-risk room. Entry into the room required appropriate garb (clean smocks, hair restraints, gloves, captive shoes), use of the hands-free hand wash and sanitizer, and a pass through the boot sanitizer. The temperature of the room was reduced from 50oF to 38oF to discourage pathogen growth.
      • Setting up a raw material handling room. A separate “dirty” area was built to break down raw material components and remove them from their packaging (corrugate cases, plastic wrap). Raw material was then fed through a wall opening where a UV light was mounted to “sanitize” the outside of the material. This helped to reduce the introduction of cardboard packaging and wood pallets into the cleanroom and drive down any pathogens that might be on the surface of the raw material.
      • Adding a packaging room. All sealed, packaged finished product passed through a wall opening into the packaging room where it was boxed up and placed on pallets. This also helped to reduce the introduction of cardboard and wood into the clean room.

The new process flow allowed for employees to move from the “clean” processing room to the raw material or packaging rooms without any extra precautions, but they were required to go back through the clean room procedures prior to going back to the processing area. Raw material and packaging employees were excluded from the cleanroom to minimize potential of contamination from personnel flow.

We also reevaluated our Hazard Analysis and Critical Control Points (HACCP), Sanitation Standard Operating Procedures (SSOPs), and Sanitation and Environmental Monitoring (EM) programs to ensure all potential risk was identified and addressed either through the new facility design or other control measures. One key takeaway was to use the EM program to identify gaps and areas of opportunity rather than to just try to prove that everything is fine. We learned that having a comprehensive EM program that can capture all the necessary data points, analyze trends and drive corrective action helped our team use the program to drive food safety and continuous improvement. It wasn’t good enough to just have an EM program in place; we needed to use the data to address gaps and mitigate identified risks.

Conclusion

Foodborne pathogens are one of the biggest risks to the safety of our foods. Listeria poses a threat to a number of food categories (dairy, protein, and produce) and should be highlighted as a significant hazard to be assessed when developing and implementing your food safety programs. Using risk-based preventive controls within your facility will help prevent adverse events related to Listeria.

Food Transparency No Longer an Option

By Maria Fontanazza
No Comments

As consumers demand to know the “who, what, when, where and how” of products they purchase, companies must focus on bringing honesty to the table to build trust.

Consumers are becoming more informed about the dangers of certain ingredients and the presence of allergens and pesticides in food. In the future, virtually the only way companies can build and retain consumer trust is through providing transparency in the food chain.

“Transparency will no longer be an option,” says John Keogh, president and principal advisor at Shantalla Inc. “Food businesses have to commit themselves to transparency as the only way to demonstrate to the market how customer-oriented they are.” Keogh discussed the need for companies to be forthright not just about what is in food, but also the entire product journey—the who, what, when, where and how—during a recent webinar by the GMA Science and Education Foundation, “Transparency in the Food Value Chain”.

Drawing on examples such as the horsemeat scandal in Europe, trust is quickly lost when dishonesty rears its head. “We need to bring a level of honesty and ethics into supply chain transparency,” says Keogh. This includes disclosing where the product is made or grown, including the state, in the case of the United States; the province, in the case of Canada; and where Japan is concerned, the prefecture. A recent example is Taiwan’s plans to require prefecture labels of Japanese food imports following the Fukushima Daiichi nuclear power plant disaster, which has raised significant concerns over radioactive contamination in food.

As the supply chain becomes increasingly global and more complex, several factors are compelling transparency. Regulations that address food safety, security, defense, and fraud will all have an impact. The Foreign Supplier Verification Program (FSVP) under FSMA will put pressure on the nearly 200 countries that import products into the United States. According to Keogh, there are 220,000 importers on record, and they have about 300,000 facilities, all of which must be inspected under the FSVP mandate. In Europe, the EU regulation 1169/2011 requires the disclosure of more information to consumers, including mandatory origin labeling of unprocessed meat from pigs, sheep, goats and poultry, mandatory nutrition labels on process foods, and disclosure of allergens in the ingredient list. Companies will also need to consider requirements for Halal and Kosher foods.

Technology plays the key role in driving consumer awareness and demand for more information, but Keogh notes there is a gap between consumer expectations from a data perspective and the ability of companies to actually deliver this data. He offers some examples of emerging technologies that companies can use to facilitate supply chain transparency. Sourcemap is a supply chain mapping solution that allows companies to link from their raw materials sites to the end customers. Companies can generate reports from various metrics and identify the weak links in their supply chain. Trace One is a product lifecycle management solution that has a focused module for transparency. The company also recently announced the first B2B social network for supply chain transparency as well as the full alignment with GS1 standards and embedding fTrace into its platform. Manufacturers using Trace One have visibility on all of their ingredients, suppliers and facilities, and can search for products that may be affected by an ingredient or facility problems related to a recall, for example.

“Food chain transparency has the potential to create new business opportunities for retailers and manufacturers,” says Keogh. Moving forward, companies will need to have a foundation of standards, specifically GS1 Standards, and use them at a deeper level to enable interoperability between the technologies that supply chain partners use. Keogh urges companies to think beyond food safety and food quality to value-based transparency to increase value not just for the end consumer but also for supply chain partners. This will also involve ensuring privacy of data surrounding pricing and proprietary information.

Using ATP-based Methods for Cleaning and Sanitation Verification

By Camila Gadotti, M.S., Michael Hughes
1 Comment

There are several factors that must be considered when selecting a reliable and accurate system for detecting adenosine triphosphate.

A common way to assess the effectiveness of cleaning and sanitation programs in food manufacturing facilities is through the use of methods that detect adenosine triphosphate (ATP). Methods based on ATP detection are inexpensive and rapid, and provide the ability to perform onsite in real-time. There are several manufacturers of ATP-based methods, but choosing the most reliable one can be a daunting task. This article will discuss how these methods work and which factors should be considered to make an informed purchasing decision.

ATP is the universal energy currency in all living cells. It is present in all viable microorganisms (with the exception of viruses) and in foodstuffs. High amounts of ATP can be found in some fresh foods like vegetables, while other foods, especially highly processed foods such as fats, oils or sugar, contain very low amounts of this molecule. It is also important to know that ATP can be found in the environment in its free form hours after a cell has died.1 An ATP bioluminescence assay operates on the principle that ATP in food/food residues and microorganisms, in the presence of a luciferin/luciferase complex, leads to light emission. This light can be measured quantitatively by a luminometer (light-detecting instrument), with results available in 10–40 seconds. The amount of light emitted is proportional to the amount of ATP on a surface and hence its cleanliness. The light emitted is typically measured in relative light units (RLUs), calibrated for each make of instrument and set of reagents. Therefore, the readings obtained from assessing the cleaning of food manufacturing facilities need to be compared with baseline data representing acceptable clean values.

Varying Optical Components

Luminometers have evolved over the years from very large and cumbersome in size to small handheld models that can be used anywhere within a manufacturing facility. Although several components are housed inside these instruments, the optical component is the most important part of a luminometer. Used to detect light coming from the ATP/luciferin/luciferase reaction, the optical component is the defining factor related to luminometer reliability, sensitivity and repeatability. Good luminometers use a photomultiplier tube (PMT) in the light detection system; however, as part of the drive toward cheaper and smaller instruments, some manufacturers have replaced PMTs with less-sensitive photodiode-based systems. When using photodiodes, the swab chemistry must be adapted to produce more intense light. This results in a shorter duration of light, decreasing the time window allotted to place the swab in the luminometer and obtain an accurate read. A PMT, however, multiplies the electrical current produced when light strikes it by millions of times, allowing this optical device to detect a single photon. This approach emits light over a longer period of time. Although the weight of the system is also dependent on factors such as the battery, case and the display screen, a luminometer constructed with a photodiode will generally weigh less than a luminometer constructed with a PMT, since the former is smaller than the latter.

Sensitivity Testing

When an ATP hygiene monitoring system has poor sensitivity or repeatability, there is substantial risk that the test result does not truly represent the hygienic status of the location tested. Therefore, it may provide false positives leading to unnecessary chemical and labor costs and production delays, or false negatives leading to the use of contaminated pieces of equipment. A system that is sensitive to low-level contamination of a surface by microorganisms and/or food residues allows sanitarians to more accurately understand the status of a test point. The ability of a system to repeat results gives one peace of mind that the result is reliable and the actions taken are appropriate. To test different ATP systems for sensitivity, one can run the following simple test using at least eight swabs per system:

•    Make at least four serial dilutions of a microbial culture and a food product in a sterile phosphate buffer solution.
•    Using an accurate pipette, dispense 20 μl of these dilutions carefully onto the tip of the swabs of each ATP system and read the swabs in the respective luminometer, following the manufacturer’s instructions.
•    Use caution when dispensing the inoculum onto the swab head to prevent any sample loss or spillage. In addition, it is very important the swabs are inoculated immediately prior to reading, which means that each swab should be inoculated one at a time and read in the respective luminometer. Repeat this process for all the swabs.


To test different ATP systems for sensitivity, one can run a simple test using at least eight swabs per system. Photo courtesy of 3M

The most sensitive system will be the one that results in the most “fail results” (using the manufacturers’ recommended pass/caution/fail limits).

One can also test different ATP systems for repeatability by the following test:

•    Prepare a dilution of a standard ATP positive control or a food product such as fluid milk in a sterile phosphate buffer. If using a standard ATP positive control, follow the manufacturer’s direction to prepare dilution. If using fluid milk, add 1 ml of milk into 99 ml of phosphate buffer.
•    Using an accurate pipette, dispense 20 μl of this standard onto the tip of the swabs of each ATP system and read these swabs in their respective luminometer, following the manufacturer’s instructions.
•    Prepare and read at least 10 swabs for each system you are evaluating, and capture the results on a digital spreadsheet.
•    Once all 10 swab results (for each system) are in the spreadsheet, calculate the mean (=average) and standard deviation (=stdev) for each system’s data set. Divide the standard deviation by the mean and transform the result in percentage; this value is called the coefficient of variation percentage (CV%).
The test with the lowest CV% is the most repeatable and will provide the most reliable information to help make the correct decisions for a food manufacturing facility.

Choosing the Right ATP System

There are many ATP systems available on the market to support cleaning and sanitation verification in manufacturing plants. Some systems are more reliable than others and will provide results that are meaningful, accurate and repeatable. Be sure, therefore, not to choose a system solely based on its price. Check for the quality of the instrument, ask the sales representative what kind of optical device is used in the construction of the instrument and, moreover, perform an evaluation running tests for both sensitivity and repeatability. It is also important to consider the functionality and usability of the software provided with the system to ensure that the software can be used to customize sample plans, store test results and produce reports and graphs.

Reference

  1. Jay, J. M., ‎Loessner, M. J., & Golden, D. A. (2008). Modern Food Microbiology.


About the Author:

Camila Gadotti, M.S., is a field technical service professional and Michael Hughes is a technical service professional with 3M Food Safety.