

Producers of food-based products are faced with challenges of maintaining the safety and quality of their products, while also managing rapid screening of raw materials and ingredients. Failure to adequately address both challenges can be costly, with estimated recall costs alone starting around $10 million, in addition to any litigation costs.1 Long-term costs can accumulate further as a result of damage to brand reputation. A vast array of methods has been employed to meet these challenges, and adoption continues to increase as technology becomes smaller, cheaper and more user friendly. One such technique is Fourier transform infrared (FTIR) spectroscopy, an analytical technique that is widely used for quick (typically 20–60 seconds per measurement) and non-destructive testing of both man-made and natural materials in food products. The uniformity and physical state of the sample (solid vs. liquid) will dictate the specifics of the hardware used to perform such analyses, and the algorithm applied to the identification task will depend, in part, on the expected variability of the ingredient.
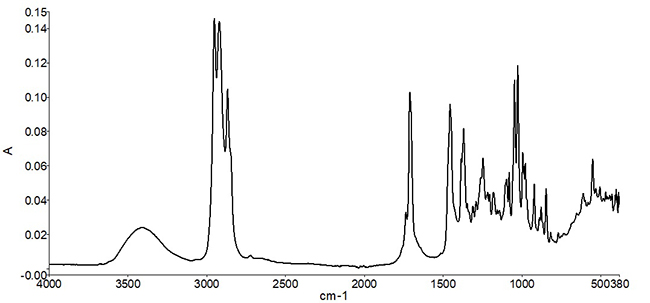
Infrared spectral measurements provide a “compositional snapshot”— capturing information related to the chemical bonds present in the material. Figure 1 shows an example of a mid-infrared spectrum of peppermint oil. Typically, the position of a peak along the x-axis (wavenumber) is indicative of the type of chemical bond, while the peak height is related either to the identity of the material, or to the concentration of the material in a mixture. In the case of peppermint oil, a complex set of spectral peaks is observed due to multiple individual naturally occurring molecular species in the oil.
Once the infrared spectrum of an ingredient is measured, it is then compared to a reference set of known good ingredients. It is important that the reference spectrum or spectra are measured with ingredients or materials that are known to be good (or pure)—otherwise the measurements will only represent lot-to-lot variation. The comparative analysis can assist lab personnel in gaining valuable information—such as whether the correct ingredient was received, whether the ingredient was adulterated or replaced for dishonest gain, or whether the product is of acceptable quality for use. The use of comparative algorithms for ingredient identification also decreases subjectivity by reducing the need for visual inspection and interpretation of the measured spectrum.
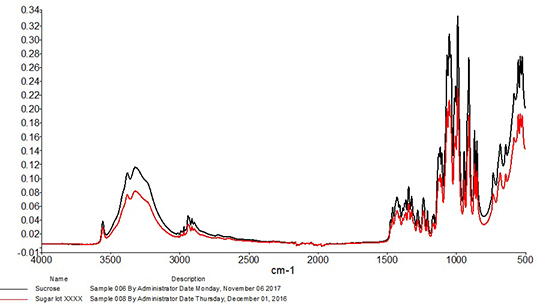
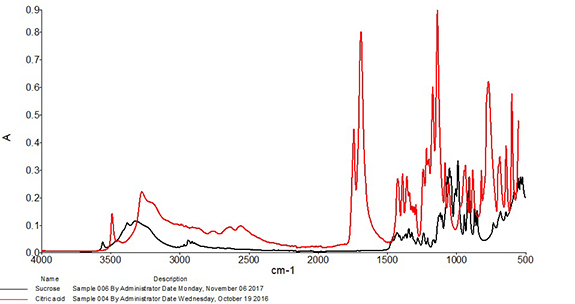
Correlation is perhaps the most widely used algorithm for material identification with infrared spectroscopy and has been utilized with infrared spectra for identification purposes at least as early as the 1970s.2 When using this approach, the correlation coefficient is calculated between the spectrum of the test sample and each spectrum of the known good set. Calculated values will range from 0, which represents absolutely no match (wrong or unexpected material), to 1, representing a perfect match. These values are typically sorted from highest to lowest, and the material is accepted or rejected based on whether the calculated correlation lies above or below an identified threshold. Due to the one-to-one nature of this comparison, it is best suited to identification of materials that have little or no expected variability. For example, Figure 2 shows an overlay of a mid-infrared spectrum of an ingredient compared to a spectrum of sucrose. The correlation calculated between the two spectra is 0.998, so the incoming ingredient is determined to be sucrose. Figure 3 shows an overlay of the same mid-infrared spectrum of sucrose with a spectrum of citric acid. Notable differences are observed between the two spectra, and a significant change in the correlation is observed, with a coefficient of 0.040 calculated between the two spectra. The citric acid sample would not pass as sucrose with the measurement and algorithm settings used in this example.
When testing samples with modest or high natural variability, acceptable materials can produce a wider range of infrared spectral features, which result in a correspondingly broad range of calculated correlation values. The spread in correlation values could be of concern as it may lead to modification of algorithm parameters or procedures to “work around” this variation. Resulting compromises can increase the potential for false positives, meaning the incorrect ingredient or adulterated material might be judged as passing. Multivariate algorithms provide a robust means for evaluating ingredient identity for samples with high natural variability.
Click below to continue to page 2.
Related Articles
-


Get the latest on regulatory and GFSI requirements.
-

Criminal food adulteration is still an underestimated, yet growing issue in Europe.
-

The database helps companies make decisions about food fraud vulnerability and economically motivated adulteration.
-
The latest violations come from a ketchup factory in Pakistan.